Mastering ASTM F1635-11: The Complete Guide to Biomaterial Degradation Testing for Researchers
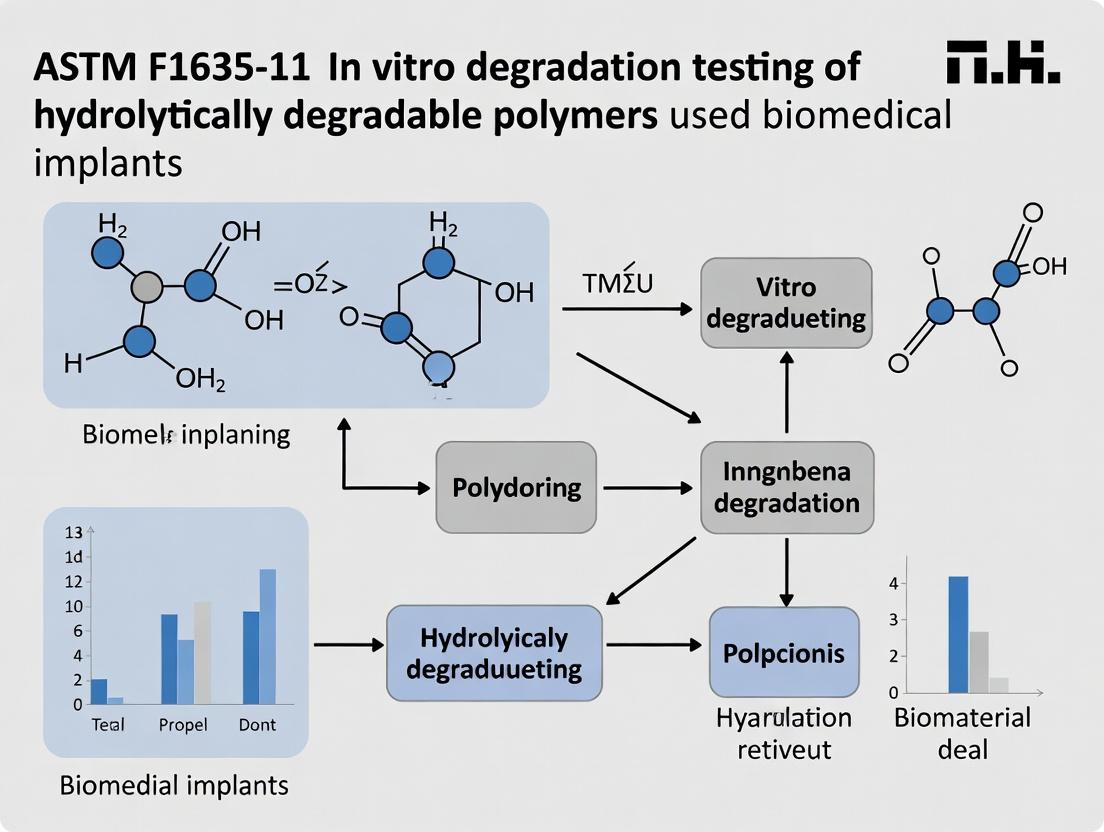
This comprehensive guide demystifies ASTM F1635-11, the critical standard for evaluating in vitro degradation of poly(L-lactic acid) (PLLA) resins and their fabricated forms.
Mastering ASTM F1635-11: The Complete Guide to Biomaterial Degradation Testing for Researchers
Abstract
This comprehensive guide demystifies ASTM F1635-11, the critical standard for evaluating in vitro degradation of poly(L-lactic acid) (PLLA) resins and their fabricated forms. Tailored for researchers, scientists, and drug development professionals, we explore the standard's foundational principles, detailed methodological execution, common troubleshooting scenarios, and its validation context compared to other methods. The article provides actionable insights for accurate, reproducible testing to ensure material safety and performance, crucial for regulatory submissions and successful biomedical product development.
What is ASTM F1635-11? Demystifying the Core Standard for PLLA Degradation Testing
Within the rigorous framework of biomaterial research and development, degradation testing is not merely a regulatory checkbox but a fundamental scientific inquiry. It provides the critical data linking a material's in vitro behavior to its projected in vivo performance and safety. This guide is framed within the context of a broader thesis on ASTM F1635-11, the standard test method for in vitro degradation testing of hydrolytically degradable polymer resins and fabricated forms for surgical implants. This standard provides the foundational methodology, but its intelligent application and interpretation are paramount for researchers, scientists, and drug development professionals aiming to predict clinical outcomes.
The ASTM F1635-11 Framework: Principles and Parameters
ASTM F1635-11 prescribes a simulated physiological solution immersion test to gauge the hydrolytic degradation of materials like polylactic acid (PLA), polyglycolic acid (PGA), and their copolymers. The core principle is accelerated testing in a controlled, reproducible environment.
Key Quantitative Parameters and Outcomes
The standard mandates tracking specific quantitative measures over time. The following table summarizes the primary data outputs and their significance.
Table 1: Key Quantitative Measures in ASTM F1635-11 Degradation Testing
| Measure | Method of Analysis | Significance for Safety & Performance |
|---|---|---|
| Mass Loss (%) | Gravimetric analysis (dry mass). | Direct indicator of material resorption rate; informs implant structural lifetime. |
| Molecular Weight Loss (Mw, Mn) | Gel Permeation Chromatography (GPC). | Tracks chain scission; correlates with loss of mechanical properties. |
| pH of Immersion Medium | pH meter. | Monitors acidic degradation product accumulation; predicts inflammatory response. |
| Mechanical Properties (e.g., Tensile Strength) | Mechanical testing (per ASTM D638). | Core performance metric; defines functional window of the implant. |
| Morphology Change | Scanning Electron Microscopy (SEM). | Visualizes surface erosion, cracking, and pore formation. |
Detailed Experimental Protocol: Adhering to ASTM F1635-11
1. Sample Preparation:
- Fabricate test specimens per relevant material specifications (e.g., compression molding, machining).
- Condition specimens in a desiccator until constant mass is achieved (typically 24-48 hrs).
- Accurately weigh each specimen (initial dry mass, M₀).
- Measure initial molecular weight and mechanical properties on control samples.
2. Immersion Study Setup:
- Prepare phosphate-buffered saline (PBS, pH 7.4 ± 0.1) or another simulated physiological fluid as the immersion medium.
- Use a sufficient volume of medium to ensure sink conditions (standard recommends 10:1 volume-to-surface area ratio).
- Place individual specimens in separate vials containing the medium.
- Incubate vials in a controlled-temperature environment at 37°C ± 1°C.
3. Sampling and Analysis:
- At predetermined time points (e.g., 1, 4, 12, 26 weeks), remove replicate samples (n≥3).
- Rinsing & Drying: Rinse samples gently with deionized water and dry to constant mass under vacuum.
- Gravimetric Analysis: Weigh dried sample (Mₜ). Calculate mass loss:
((M₀ - Mₜ) / M₀) * 100%. - Medium Analysis: Record pH of the used immersion medium.
- Material Analysis: Perform GPC for molecular weight, SEM for morphology, and mechanical testing on the dried specimens.
- Statistical Analysis: Report mean and standard deviation for all quantitative measures.
Visualizing the Degradation Cascade and Workflow
The degradation process initiates a predictable cascade of events, which the testing workflow is designed to monitor.
Diagram 1: Hydrolytic Degradation Cascade of Polyesters
Diagram 2: ASTM F1635-11 Core Experimental Workflow
The Scientist's Toolkit: Key Research Reagent Solutions
Successful degradation testing relies on precise materials and reagents.
Table 2: Essential Research Reagents & Materials for Degradation Testing
| Item | Function / Rationale |
|---|---|
| Phosphate-Buffered Saline (PBS), pH 7.4 | Simulates ionic strength and pH of physiological fluid. Sodium azide (0.02% w/v) may be added to inhibit microbial growth in long-term studies. |
| High-Purity Water (Type I, 18.2 MΩ·cm) | Used for preparing all solutions and rinsing samples to avoid contamination from ions that could catalyze degradation. |
| Reference Polymers (e.g., PLA, PGA Standards) | Well-characterized polymers with known molecular weights and dispersity for GPC calibration and as experimental controls. |
| GPC/SEC Solvents (e.g., HPLC-grade THF, Chloroform) | High-purity solvents for dissolving polymer samples and running GPC analysis without introducing artifacts. |
| pH Standard Buffers (pH 4.0, 7.0, 10.0) | For precise calibration of the pH meter before measuring the immersion medium. |
| Vacuum Desiccator & Drierite | Provides a dry, controlled environment for achieving constant mass of hygroscopic polymer samples before and after immersion. |
| Inert Sample Vials (e.g., Glass) | Prevents leaching of additives from plastic containers that could interfere with degradation chemistry or analytics. |
Advancing Beyond the Standard: CorrelatingIn VitroData toIn VivoPerformance
The ultimate goal of degradation testing is prediction. Current research focuses on refining ASTM F1635-11 protocols to better mimic in vivo conditions. This includes studying the effects of dynamic strain (mechanically active environments), protein adsorption, and enzymatic activity on degradation rates. By systematically applying the standard and thoughtfully extending its framework, researchers can generate robust data that critically informs the safety, efficacy, and design of next-generation biomaterials.
This whitepaper details the genesis, technical scope, and specific applicability of the ASTM F1635-11 standard, a pivotal benchmark for evaluating the in vitro degradation of polymeric biomaterials within a simulated physiological environment. Framed within a broader thesis on standardized biomaterial testing, this document provides researchers and development professionals with a foundational guide to the standard’s history, its rigorous experimental protocols, and its critical role in ensuring the safety and performance prediction of absorbable implants.
Genesis and Historical Context
The ASTM F1635 standard, initially published in 1995, was developed in response to the burgeoning field of absorbable polymeric medical devices (e.g., sutures, fixation devices, tissue scaffolds). Prior to its establishment, a lack of standardized in vitro methodologies led to inconsistent degradation data, hindering reliable material comparison and performance prediction. The standard was created by Committee F04 on Medical and Surgical Materials and Devices to provide a controlled, reproducible means to measure mass loss and physical property changes of polymers in a simulated physiological fluid. The 2011 revision (F1635-11) refined procedural details and precision statements, solidifying its role as a pre-clinical screening tool essential for regulatory submissions (e.g., to the FDA) and research validation.
Scope and Specific Applicability
ASTM F1635-11, titled “Standard Test Method for In Vitro Degradation Testing of Hydrolytically Degradable Polymer Resins and Fabricated Forms for Surgical Implants,” defines a specific immersion test in a phosphate-buffered solution (pH 7.4 ± 0.1) at 37°C. Its scope is intentionally focused:
- Materials: Hydrolytically degradable polymers (e.g., poly(L-lactic acid) (PLLA), poly(glycolic acid) (PGA), poly(lactic-co-glycolic acid) (PLGA), polycaprolactone (PCL)).
- Forms: Testable as solid resin specimens or in fabricated forms (e.g., molded shapes, fibers, porous scaffolds).
- Primary Measurable: Percent mass loss over time as the primary indicator of degradation.
- Key Applications:
- Quality control and lot-to-lot consistency verification.
- Comparative ranking of different polymer compositions or processing conditions.
- Providing degradation data for regulatory filings (510(k), PMA).
- Serving as a controlled baseline before complex in vivo or cell-based studies.
It is critical to note that the standard explicitly excludes testing of devices containing drugs, biologics, or ceramic fillers, and does not simulate dynamic mechanical loading or specific biological interactions (e.g., enzymatic activity).
Core Experimental Protocol
The following is the detailed methodology prescribed by ASTM F1635-11.
3.1. Reagent and Material Preparation
- Phosphate-Buffered Saline (PBS): 0.1M, pH 7.4 ± 0.1, prepared with reagent-grade chemicals and deionized water. Sodium azide (0.03% w/v) may be added to inhibit microbial growth.
- Test Specimens: A minimum of five specimens per material per time point. Specimens are cleaned, dried to constant mass in a desiccator, and precisely weighed (initial mass, M₀).
- Equipment: Incubation oven (37°C ± 1°C), analytical balance (±0.01 mg), vacuum desiccator, pH meter, and sterile containers.
3.2. Test Procedure
- Immersion: Each specimen is placed in a separate container with a PBS volume-to-specimen surface area ratio ≥ 20 mL/cm².
- Incubation: Containers are sealed and placed in the 37°C oven for predetermined time intervals (e.g., 1, 3, 6, 12, 24 weeks).
- Solution Monitoring: The pH of the PBS is checked regularly (e.g., weekly) and replaced with fresh, pre-warmed PBS if the pH shifts beyond 7.4 ± 0.2.
- Specimen Retrieval: At each time point, specimens are removed, gently rinsed with deionized water, and dried to constant mass (M_t) under vacuum desiccation.
- Mass Loss Calculation: Percent mass loss is calculated for each specimen: `[(M₀ - M_t) / M₀] x 100%.
3.3. Data Reporting and Analysis Report includes mean mass loss, standard deviation, sample size, PBS change schedule, and observations of physical changes (e.g., fragmentation, swelling). Data is typically plotted as mean mass loss (%) versus time.
Table 1: Typical Degradation Data for Common Polymers (Illustrative)
| Polymer | Initial Molecular Weight (kDa) | 12-Week Mass Loss (%) (Mean ± SD) | Time to 50% Mass Loss (Weeks, approx.) | Key Physical Change Observed |
|---|---|---|---|---|
| PGA | 100 | 85 ± 5 | 12-16 | Rapid fragmentation, pH drop |
| PLGA 50:50 | 80 | 65 ± 8 | 8-12 | Surface erosion, swelling |
| PLLA | 120 | 8 ± 3 | >52 | Slow bulk erosion, slight crystallinity increase |
| PCL | 80 | 5 ± 2 | >78 | Minimal change, ductile |
Workflow and Decision Pathway
The following diagram outlines the logical experimental workflow and decision-making process mandated by ASTM F1635-11.
ASTM F1635-11 In Vitro Degradation Testing Workflow
The Scientist's Toolkit: Essential Research Reagents & Materials
The following table details key consumables and reagents essential for conducting compliant ASTM F1635-11 testing.
Table 2: Key Research Reagent Solutions for ASTM F1635-11 Testing
| Item | Function & Specification | Critical Notes |
|---|---|---|
| Phosphate Buffered Saline (PBS) | Simulates ionic strength and pH of physiological fluid. 0.1M, pH 7.4 ± 0.1. | Must be sterile-filtered. Addition of 0.03% sodium azide is recommended for long-term studies to prevent microbial growth. |
| Sodium Azide (NaN₃) | Bacteriostatic agent to maintain sterility in the immersion medium. | Handle with care; toxic. Low concentration does not significantly affect hydrolysis kinetics. |
| Desiccant (e.g., Drierite) | Creates a dry environment in a desiccator for drying specimens to constant mass. | Must be regularly regenerated or replaced to ensure effective drying. |
| Vacuum Pump / Desiccator | Removes residual moisture from specimens post-retrieval prior to weighing. | Essential for achieving "constant mass," defined as < ±0.1 mg change over 24h drying. |
| Analytical Microbalance | Precisely measures specimen mass (accuracy ±0.01 mg or better). | Calibration must be current and traceable to standard weights. |
| pH Meter & Buffers | Monitors and verifies the pH of the PBS before and during incubation. | Regular calibration with pH 4.01, 7.00, and 10.01 buffers is mandatory. |
| Sterile Sealed Containers | Holds individual specimen-PBS systems, prevents evaporation and contamination. | Polypropylene or glass are suitable. Must be inert and not adsorb degradation products. |
| Oven / Incubator | Maintains constant temperature at 37°C ± 1°C. | Forced air circulation is preferred to ensure uniform temperature distribution. |
ASTM F1635-11, "Standard Test Method for in vitro Degradation Testing of Hydrolytically Degradable Polymer Resins and Fabricated Forms for Surgical Implants," provides the critical framework for evaluating absorbable polymers in biomedical applications. This whitepaper deconstructs the core terminology and measurement principles underpinning this standard, focusing on hydrolytic degradation, molecular weight changes, and mass loss. Understanding the interrelationship of these parameters is essential for researchers and drug development professionals to predict in vivo performance, device longevity, and biocompatibility.
Core Definitions
Hydrolytic Degradation: The chain scission process by which polymer main chains are cleaved via reaction with water, leading to a reduction in molecular weight and eventual loss of mass. This is the primary degradation mechanism for many biomedical polymers (e.g., poly(lactic-co-glycolic acid) [PLGA], polycaprolactone [PCL]). The rate is influenced by polymer chemistry, crystallinity, device geometry, and environmental pH.
Molecular Weight (Mw, Mn): A measure of the size of polymer chains. Weight-average molecular weight (Mw) and number-average molecular weight (Mn) are critical metrics. Degradation is initially manifested as a decrease in Mw and Mn due to chain scission, often measured via Gel Permeation Chromatography (GPC).
Mass Loss: The physical loss of material from a specimen as degradation byproducts (oligomers and monomers) become soluble and diffuse into the surrounding aqueous medium. Mass loss typically follows the initial drop in molecular weight.
Table 1: Typical Degradation Timeline for Common Bioabsorbable Polymers
| Polymer | Time to 50% Mw Loss (weeks) | Time to Onset of Mass Loss (weeks) | Time to Complete Mass Loss (weeks) | Key Influencing Factor |
|---|---|---|---|---|
| Poly(L-lactic acid) (PLLA) | 24-52 | 40-78 | 78-156 | High crystallinity slows hydrolysis |
| Poly(D,L-lactic acid) (PDLLA) | 12-24 | 18-36 | 36-52 | Amorphous structure accelerates process |
| 50:50 Poly(lactic-co-glycolic acid) (PLGA) | 4-8 | 5-10 | 10-16 | High glycolide content increases hydrophilicity |
| Poly(glycolic acid) (PGA) | 2-4 | 3-6 | 6-12 | Highly crystalline but hydrophilic |
| Polycaprolactone (PCL) | >104 | >156 | >208 | High hydrophobicity slows degradation |
Table 2: Key Analytical Methods per ASTM F1635-11 Guidance
| Parameter | Primary Test Method | Sample Requirement | Key Output Metrics |
|---|---|---|---|
| Molecular Weight Change | Gel Permeation Chromatography (GPC) | 2-5 mg dissolved in suitable solvent | Mw, Mn, Polydispersity Index (PDI) |
| Mass Loss | Gravimetric Analysis | Dry mass pre- and post-incubation | Percentage mass remaining |
| Thermal Properties | Differential Scanning Calorimetry (DSC) | 3-10 mg | Glass Transition (Tg), Melting Temp (Tm), Crystallinity (%) |
| Morphology | Scanning Electron Microscopy (SEM) | Coated specimen | Surface erosion vs. bulk erosion patterns |
Experimental Protocols
Protocol 1: Standard in vitro Hydrolytic Degradation Study (ASTM F1635-11 Based)
- Specimen Preparation: Fabricate test specimens (e.g., discs, films) to specified dimensions (e.g., 10 mm diameter x 1 mm thick). Dry in a vacuum desiccator to constant mass (M₀). Record initial dry mass.
- Molecular Weight Baseline: Determine initial Mw and Mn for a subset of samples using GPC.
- Immersion: Place individual specimens in vials containing a buffered solution (commonly phosphate-buffered saline [PBS] at pH 7.4 ± 0.1). Maintain a standard volume-to-surface area ratio (e.g., 1 mL per 20 mm²). Seal vials.
- Incubation: Place vials in a controlled-temperature environment (37°C ± 1°C).
- Sample Retrieval & Analysis: At predetermined time points (e.g., 1, 2, 4, 8, 12, 26 weeks):
- Remove specimen, rinse with deionized water, and dry to constant mass (Mₜ). Calculate mass loss: % Mass Remaining = (Mₜ / M₀) * 100.
- Analyze molecular weight via GPC on the dried sample.
- Optionally, analyze thermal properties (DSC) and surface morphology (SEM).
- Buffer Management: The immersion medium should be replaced periodically (e.g., weekly) to maintain pH and avoid saturation of degradation products.
Protocol 2: Gel Permeation Chromatography (GPC) for Molecular Weight Determination
- Sample Preparation: Dissolve the dried polymer specimen (approx. 2 mg) in the GPC eluent (e.g., Tetrahydrofuran [THF] for PLGA, Chloroform for PCL) at a known concentration (∼1 mg/mL). Filter through a 0.2 μm PTFE syringe filter.
- System Calibration: Create a calibration curve using narrow dispersity polystyrene (PS) or polymethyl methacrylate (PMMA) standards of known molecular weights.
- Chromatography: Inject sample into the GPC system (pump, columns, detector – typically refractive index [RI]). Use a constant flow rate (e.g., 1.0 mL/min).
- Data Analysis: Use specialized software to calculate Mw, Mn, and PDI from the chromatogram by comparing retention times to the calibration curve.
Diagrams
Hydrolytic Degradation Pathway
ASTM F1635-11 Test Workflow
The Scientist's Toolkit: Research Reagent Solutions
Table 3: Essential Materials for Hydrolytic Degradation Studies
| Item | Function | Example/Notes |
|---|---|---|
| Phosphate Buffered Saline (PBS) | Standard immersion medium simulating physiological pH and ionic strength. | 10x PBS concentrate, pH 7.4, sterile filtered. |
| GPC/SEC System with RI Detector | Absolute determination of molecular weight averages and distribution. | Systems from Agilent, Waters, or Malvern; requires appropriate columns. |
| GPC/SEC Standards | Calibration of the GPC system for accurate molecular weight calculation. | Narrow dispersity Polystyrene (PS) or PMMA standards. |
| Analytical Balance (Micro) | Precise gravimetric measurement of mass loss (to 0.01 mg). | Essential for tracking small mass changes over time. |
| Vacuum Oven/Desiccator | Drying specimens to constant mass before and after incubation. | Maintains dry environment; use with phosphorus pentoxide or silica gel. |
| pH Meter & Buffer Solutions | Regular monitoring and adjustment of immersion medium pH. | Critical as acidic degradation products can autocatalyze hydrolysis. |
| 0.2 μm PTFE Syringe Filters | Filtering polymer solutions for GPC analysis to remove particulates. | Prevents column damage and ensures accurate chromatograms. |
| Appropriate HPLC-grade Solvents | Dissolving polymers for GPC analysis (specific to polymer chemistry). | THF (for PLGA, PGA), Chloroform (for PCL, PLLA), Hexafluoroisopropanol (for some polyesters). |
| Controlled Temperature Incubator | Maintaining physiological temperature (37°C) for incubation. | Stable temperature (±1°C) is crucial for reproducible kinetics. |
Within the rigorous framework of biomaterials research and development, particularly for implantable medical devices, the evaluation of degradation behavior is non-negotiable. ASTM F1635-11, "Standard Test Method for in vitro Degradation Testing of Hydrolytically Degradable Polymer Resins and Fabricated Forms for Surgical Implants," provides the critical methodology for this assessment. Its essentiality for regulatory submissions to agencies like the U.S. Food and Drug Administration (FDA) and the European Medicines Agency (EMA) stems from its role in establishing standardized, reproducible, and predictive data on material performance, which directly correlates to safety and efficacy endpoints required by regulators.
The Role of Standardization in Regulatory Science
Regulatory agencies mandate that medical device submissions demonstrate substantial equivalence (for 510(k)) or safety and effectiveness (for PMA). A core component of this demonstration for degradable materials, such as those used in orthopedic fixation devices, sutures, and drug-eluting scaffolds, is a comprehensive understanding of their degradation profile. ASTM F1635-11 provides the standardized "language" and experimental framework to generate this data.
- Predictability: It offers a controlled in vitro model to predict in vivo degradation rates and modes, informing preclinical study design.
- Reproducibility: The standard minimizes inter-laboratory variability, ensuring data submitted by sponsors is reliable and auditable.
- Risk Mitigation: By identifying potential failure modes (e.g., rapid loss of mechanical strength, unexpected byproduct release) early, it guides material selection and device design, reducing clinical risk.
Core Technical Protocols of ASTM F1635-11
The standard outlines specific methodologies for sample preparation, conditioning, and analysis.
Key Experimental Protocol: Mass Loss and Molecular Weight Change
This is the primary quantitative method for tracking degradation.
- Sample Preparation: Specimens are cut to specified dimensions (e.g., 10 mm x 10 mm x 1 mm), cleaned, and dried to constant mass.
- Initial Characterization: Initial dry mass (M₀) is recorded. Initial molecular weight (Mₙ₀ and/or Mᵥ₀) is determined via Gel Permeation Chromatography (GPLC).
- Immersion: Specimens are immersed in a phosphate-buffered saline (PBS) solution (pH 7.4 ± 0.1) at 37°C ± 1°C. The solution volume-to-sample surface area ratio is maintained (≥ 20 mL/cm²) to ensure sink conditions.
- Time-Point Sampling: Triplicate specimens are removed at predetermined time points (e.g., 1, 4, 12, 26, 52 weeks).
- Analysis: Retrieved samples are rinsed, dried to constant mass, and weighed (Mₜ). Mass loss percentage is calculated. Molecular weight (Mₙₜ) is determined via GPLC.
- Solution Analysis: The immersion medium is analyzed for pH change and the release of degradation products (e.g., lactic acid, glycolic acid) via High-Performance Liquid Chromatography (HPLC).
Data Presentation: Simulated Degradation Data for PLA (Poly(L-lactic acid))
The following table summarizes typical data generated per ASTM F1635-11, crucial for an Investigational Device Exemption (IDE) or marketing application.
Table 1: In Vitro Degradation Profile of PLA (97% Crystalline) per ASTM F1635-11
| Time Point (Weeks) | Mass Remaining (%) | Mₙ Retention (%) | pH of Immersion Medium | Notable Observations |
|---|---|---|---|---|
| 0 | 100.0 ± 0.5 | 100.0 ± 3.0 | 7.40 ± 0.05 | - |
| 4 | 99.5 ± 0.7 | 85.2 ± 4.1 | 7.38 ± 0.05 | No visible change |
| 12 | 98.1 ± 1.0 | 62.3 ± 5.5 | 7.30 ± 0.08 | Slight surface erosion |
| 26 | 92.4 ± 2.3 | 28.5 ± 6.7 | 7.15 ± 0.12 | Significant loss of tensile strength |
| 52 | 75.8 ± 5.6 | 10.1 ± 3.2 | 6.95 ± 0.20 | Fragmentation begins |
Table 2: Key Research Reagent Solutions for ASTM F1635-11 Testing
| Item Name | Function / Rationale |
|---|---|
| Phosphate Buffered Saline (PBS), pH 7.4 | Simulates physiological ionic strength and pH; the primary immersion medium for hydrolytic degradation. |
| Sodium Azide (0.02% w/v) | Added to PBS to inhibit microbial growth during long-term studies, preventing confounding mass loss. |
| HPLC-Grade Water | For rinsing samples and preparing mobile phases for GPLC/HPLC analysis to avoid contaminants. |
| Polystyrene Standards | Used for calibrating the GPLC system to determine accurate molecular weight distributions. |
| Certified Reference Materials (e.g., Lactic Acid) | Used as standards for HPLC calibration to quantify degradation byproducts in solution. |
Regulatory Submission Mapping
Data generated under ASTM F1635-11 directly informs critical sections of regulatory dossiers:
- FDA Pre-Submission & 510(k)/PMA: Demonstrates biocompatibility (per ISO 10993-13: Identification and Quantification of Degradation Products) and provides engineering performance data.
- EMA Technical Documentation (Annex II of MDR): Supports the "Design and Manufacturing Information" and "Risk Management File" by providing validated methods for verifying material safety.
- Common Ground: Both agencies require a justification of test conditions (e.g., buffer choice, temperature), raw data, statistical analysis, and a discussion linking in vitro results to projected in vivo performance and potential biological responses.
Diagram: ASTM F1635-11 Workflow in Regulatory Pathway
ASTM F1635-11 is not merely a recommended test but a foundational pillar for the regulatory approval of hydrolytically degradable medical devices. Its precise protocols generate the quantitative, comparable, and auditable data that FDA and EMA reviewers rely upon to assess the critical quality attribute of degradation. By adhering to this standard, researchers and sponsors provide robust scientific evidence that bridges material science, preclinical research, and clinical safety, thereby facilitating a more efficient and predictable regulatory review process.
ASTM F1635-11, "Standard Test Method for in vitro Degradation Testing of Hydrolytically Degradable Polymer Resins and Fabricated Forms for Surgical Implants," provides a critical framework for evaluating polymers like Poly(L-lactic acid) (PLLA). This guide details the application of this standard to PLLA in its various forms—raw resin, engineered scaffolds, and final implantable devices. The standard's focus on mass loss, molecular weight change, and mechanical property decay under simulated physiological conditions is paramount for predicting in vivo performance and ensuring patient safety.
PLLA Degradation Mechanisms & Pathways
PLLA undergoes bulk erosion primarily via hydrolysis of its ester backbone. The process is autocatalytic, as acidic degradation products (lactic acid oligomers and monomers) accelerate further chain scission.
Diagram 1: PLLA Hydrolytic Degradation Pathway
Core Experimental Protocols per ASTM F1635-11
Specimen Preparation & Conditioning
- Materials: PLLA resin (e.g., 100 kDa), compression molding press, ISO phosphate-buffered saline (PBS), desiccator.
- Protocol: Fabricate standard dumbbell (Type V) or rectangular specimens. Condition specimens in a desiccator at 37°C to constant weight (dry mass, W₀). Record initial dimensions.
In VitroDegradation Study
- Incubation Medium: Pre-heated PBS (pH 7.4 ± 0.1) or PBS with 0.02% sodium azide to prevent microbial growth.
- Temperature: 37 ± 1°C (water bath or oven).
- Volume-to-Surface Area Ratio: As per standard, typically ≥ 20 mL per cm² specimen surface area.
- Time Points: 0, 1, 2, 4, 8, 12, 16, 26, 52 weeks. Medium should be replaced at each measurement interval to maintain pH and sink conditions.
- Triplicates: Minimum n=3 per time point.
Key Measurements at Each Time Point
- Mass Loss: Retrieve specimens, rinse with deionized water, dry to constant mass (Wₜ). Calculate percentage mass loss:
[(W₀ - Wₜ) / W₀] × 100. - Molecular Weight: Analyze dried specimens via Gel Permeation Chromatography (GPC) against polystyrene standards. Report Mₙ (number average) and Mᵥ (weight average).
- Thermal Properties: Use Differential Scanning Calorimetry (DSC) to determine glass transition (Tg), cold crystallization (Tcc), and melt temperatures (Tm), and percent crystallinity.
- Mechanical Properties (for scaffolds/implants): Perform tensile or compressive testing per ASTM D638 or D695. Report modulus, ultimate strength, and elongation at break.
Table 1: Representative *In Vitro Degradation Data for PLLA (100 kDa, amorphous, 37°C, PBS)*
| Time (Weeks) | Mass Loss (%) | Mᵥ (kDa) | Crystallinity (%) | Tensile Strength Retention (%) |
|---|---|---|---|---|
| 0 | 0.0 | 100.0 | 5 | 100 |
| 4 | < 0.5 | 85.2 | 8 | 98 |
| 12 | 1.2 | 65.7 | 15 | 92 |
| 26 | 3.8 | 40.1 | 25 | 75 |
| 52 | 12.5 | 18.9 | 32 | 45 |
Table 2: Impact of PLLA Form on Degradation Kinetics (at 26 weeks)
| PLLA Form | Initial Mᵥ (kDa) | Mass Loss (%) | Key Feature Influencing Rate |
|---|---|---|---|
| Solid Resin Disk | 100 | 3.8 | Low surface area, bulk erosion |
| Porous Scaffold | 100 | 15.2 | High porosity increases SA:V |
| Suture Fiber | 100 | 8.5 | High orientation, higher crystallinity slows hydrolysis |
| Nanoparticle | 100 | > 90* | Extremely high surface area |
Note: Nanoparticles may be fully degraded/resorbed by this time point.
The Scientist's Toolkit: Research Reagent Solutions
Table 3: Essential Materials for PLLA Degradation Research
| Item/Catalog Example | Function in Protocol |
|---|---|
| High-Purity PLLA Resin (e.g., Lacty, PURASORB) | Primary test material with defined initial molecular weight and D-isomer content. |
| Phosphate Buffered Saline (PBS), pH 7.4 | Simulates physiological ionic strength and pH for hydrolytic degradation. |
| Sodium Azide (NaN₃), 0.02% w/v | Bacteriostatic agent added to PBS to prevent microbial growth in long-term studies. |
| GPC/SEC System with Refractive Index Detector | Analyzes molecular weight distribution and average Mᵥ/Mₙ over time. |
| Differential Scanning Calorimeter (DSC) | Tracks thermal property changes (Tg, crystallinity) indicating chain mobility and degradation. |
| ISO 37 Type V Dumbbell Cutting Die | Standardizes specimen geometry for reproducible mechanical and degradation testing. |
| Vacuum Desiccator with Drierite | Conditions specimens to a constant dry mass (W₀) before and during the study. |
Diagram 2: ASTM F1635-11 PLLA Test Workflow
Considerations for Specific PLLA Forms
- Resins: Characterize inherent viscosity and residual monomer content per ASTM D2857.
- Scaffolds: Porosity (measured via mercury intrusion porosimetry or micro-CT) and pore architecture significantly accelerate degradation. Monitor dimensional stability.
- Implantable Devices (e.g., screws, meshes): Sterilization method (gamma irradiation, ethylene oxide) can affect initial Mw and degradation onset. Test final sterilized form.
Rigorous application of ASTM F1635-11 to PLLA materials provides predictive, comparable data essential for regulatory submissions and clinical translation. Understanding the interplay between material form, morphology, and degradation kinetics is critical for designing safe and effective resorbable medical devices.
Within the context of biomaterials research and development, the prediction of long-term in vivo performance is paramount. ASTM F1635-11, "Standard Test Method for In Vitro Degradation Testing of Hydrolytically Degradable Polymer Resins and Fabricated Forms for Surgical Implants," provides a critical framework. This whitepaper details the fundamental scientific principles and methodologies underlying simulated in vitro hydrolytic degradation, a core component of compliant testing, serving researchers and drug development professionals engaged in evaluating absorbable polymers for medical devices.
Core Scientific Principles
Hydrolytic degradation of polymers, particularly polyesters like poly(lactic-co-glycolic acid) (PLGA), poly(L-lactic acid) (PLLA), and poly(glycolic acid) (PGA), proceeds via the cleavage of hydrolytically labile ester bonds in the polymer backbone. The process is governed by several interconnected factors:
- Water Absorption: The initial ingress of aqueous medium into the polymer matrix.
- Ester Bond Hydrolysis: The nucleophilic attack by water molecules, leading to chain scission. This can be autocatalytic due to the generation of acidic carboxyl end groups.
- Diffusion-Controlled Kinetics: The rate of degradation is often controlled by the diffusion of water in and oligomers/acidic by-products out of the polymer bulk.
- Crystallinity & Morphology: Amorphous regions degrade faster than crystalline ones, affecting the overall degradation profile and mechanical integrity loss.
The autocatalytic effect is a hallmark of bulk-eroding polymers. As degradation proceeds internally, acidic monomers and oligomers become trapped, lowering the local pH and accelerating ester hydrolysis in the core, often leading to faster internal degradation than at the surface.
Methodologies & Protocols Aligned with ASTM F1635-11
ASTM F1635-11 outlines standardized conditions for reproducible testing. Key experimental parameters and detailed protocols are summarized below.
Standard Test Conditions & Data
The standard specifies using phosphate-buffered saline (PBS, pH 7.4 ± 0.1) at 37 ± 1°C to simulate physiological conditions. Agitation is recommended. Testing duration should be sufficient to characterize the degradation profile.
Table 1: Key Quantitative Parameters Monitored During In Vitro Hydrolytic Degradation Testing
| Parameter | Measurement Technique | Significance | Typical Data Range (e.g., PLGA 50:50) |
|---|---|---|---|
| Mass Loss (%) | Gravimetric Analysis | Direct indicator of material dissolution and erosion. | 0% (initial) to >80% (complete erosion) over weeks. |
| Molecular Weight Loss (Mw, Mn) | Gel Permeation Chromatography (GPC) | Tracks chain scission, precedes mass loss. | Mw can decrease to 50% of initial within 2-4 weeks. |
| pH of Degradation Medium | pH Meter | Monitors acidic by-product release; indicates autocatalysis. | PBS pH may drop to ~6.8 near polymer surface/inside pores. |
| Water Absorption (%) | Gravimetric Analysis | Indicates hydrophilicity and swelling capacity. | Can increase by 5-20% before significant mass loss. |
| Mechanical Properties (Tensile/Shear) | Mechanical Tester | Critical for load-bearing implant functionality. | Strength loss often correlates with molecular weight drop. |
Detailed Experimental Protocol
Title: Protocol for Simulated In Vitro Hydrolytic Degradation per ASTM F1635-11 Guidelines
Materials: Polymer specimens (e.g., discs, films), Phosphate Buffered Saline (PBS, 0.1M, pH 7.4), Sodium azide (0.02% w/v), Analytical balance (±0.01 mg), Oven (37°C), Agitating incubator or water bath, Filter papers, Desiccator.
Procedure:
- Specimen Preparation: Cut or mold polymer into standardized specimens (e.g., 10 mm diameter x 1 mm thick discs). Measure initial dimensions.
- Drying: Dry specimens to constant mass (M₀) in a vacuum desiccator.
- Degradation Setup: Place each specimen in a sealed vial containing a pre-warmed (37°C) PBS solution with 0.02% sodium azide to inhibit microbial growth. Use a volume-to-surface area ratio ≥20 mL/cm² as per standard.
- Incubation: Place vials in an incubator or agitating water bath at 37 ± 1°C.
- Sampling: At predetermined time points (e.g., 1, 2, 4, 8, 12, 16 weeks), remove triplicate specimens from the medium.
- Rinsing & Drying: Rinse retrieved specimens with deionized water and dry to constant mass (Mₜ) in a vacuum desiccator.
- Analysis: Calculate mass loss:
((M₀ - Mₜ) / M₀) x 100%. Analyze specimens via GPC, SEM, etc. - Medium Analysis: Monitor pH of the remaining degradation medium at each time point.
Visualizing Key Processes
Diagram 1: Hydrolytic Degradation & Autocatalysis Pathway
Diagram 2: In Vitro Degradation Testing Workflow
The Scientist's Toolkit: Key Research Reagent Solutions
Table 2: Essential Materials for Simulated Hydrolytic Degradation Studies
| Item | Function & Rationale |
|---|---|
| Phosphate Buffered Saline (PBS), 0.1M, pH 7.4 | Simulates physiological ionic strength and pH; maintains osmolarity. |
| Sodium Azide (NaN₃), 0.02% w/v | Bacteriostatic agent added to PBS to prevent microbial growth during long-term studies, ensuring mass loss is due to hydrolysis. |
| High-Purity Water (Type I) | Used for preparing buffers and rinsing specimens to avoid contamination from ions or organics. |
| Characterized Polymer Resin (e.g., PLGA) | Polymer with known initial molecular weight, lactide:glycolide ratio, crystallinity, and end-group chemistry. |
| pH Standard Buffers (4.0, 7.0, 10.0) | For precise calibration of pH meters to accurately track acidification of degradation medium. |
| Molecular Weight Standards (e.g., Polystyrene, PMMA) | Essential for calibrating Gel Permeation Chromatography (GPC) systems to determine polymer Mn, Mw, and PDI over time. |
Step-by-Step Protocol: Executing ASTM F1635-11 Degradation Testing in Your Lab
1.0 Introduction within the Context of ASTM F1635-11 The ASTM F1635-11 standard, "Standard Test Method for in vitro Degradation Testing of Hydrolytically Degradable Polymer Resins and Fabricated Forms for Surgical Implants," provides the critical framework for evaluating the degradation of biomaterials intended for clinical use. The precision, reproducibility, and biological relevance of the entire degradation study hinge upon the rigor of pre-test preparation. This phase, encompassing sample sizing, conditioning, and initial characterization, establishes the baseline from which all degradation metrics (mass loss, molecular weight decline, mechanical property changes) are measured. Inadequate preparation can introduce significant variability, obscuring true material performance and compromising adherence to the standard's requirements for specimen consistency.
2.0 Core Pre-Test Protocols
2.1 Sample Sizing and Fabrication Specimen dimensions are dictated by the subsequent analytical techniques and must be machined or molded with high precision to minimize inter-specimen variance.
Protocol:
- Material Form: For compression-molded sheets or extruded rods, ensure the bulk material is free of visible defects.
- Cutting/Machining: Use a precision die cutter (for sheets) or a lathe/milling machine (for rods) with sharp, clean tools. Cutting fluids must be non-reactive with the polymer (e.g., use chilled air or a biocompatible lubricant).
- Deburring: Carefully remove all burrs and rough edges using fine-grit sandpaper (e.g., 600-grit) or a precision blade.
- Cleaning: Ultricate specimens in a sequence of two solvents: first a non-polar solvent (e.g., hexane) to remove machining oils, followed by a polar solvent (e.g., ethanol or isopropanol). Duration: 10 minutes per solvent bath.
- Drying: Vacuum-dry specimens at ambient temperature (or below the polymer's glass transition temperature) to a constant mass. Record this as the initial dry mass (m₀).
2.2 Sample Conditioning & Hydration ASTM F1635-11 requires testing in a simulated physiological fluid (e.g., phosphate-buffered saline, PBS, pH 7.4 ± 0.2 at 37°C). Pre-hydration establishes a consistent starting state for hydrolysis.
Protocol:
- Sterilization (if required): Perform sterilization (e.g., ethylene oxide, gamma irradiation) according to the intended clinical pathway. Document the method and parameters.
- Hydration: Immerse pre-weighed, sterile specimens in degassed PBS (0.1M, pH 7.4) and place in an incubator at 37°C ± 1°C.
- Equilibration: Soak for 24-72 hours (duration must be validated for the specific polymer to reach full hydration equilibrium).
- Pat-Drying: Remove specimens, gently blot with a lint-free laboratory wipe to remove surface droplets, and immediately weigh to obtain the hydrated mass (mₕ). This step precedes initial characterization for dimensional and mass metrics.
2.3 Initial Characterization
2.3.1 Molecular Weight (Mw) Analysis via Gel Permeation Chromatography (GPC) Protocol:
- Sample Preparation: Dissolve a representative, pre-dried specimen (~5 mg) in the appropriate GPC solvent (e.g., THF for PLGA, HFIP for polyesters) at a known concentration (~2 mg/mL). Filter through a 0.2 µm PTFE syringe filter.
- System Calibration: Use a narrow dispersity polystyrene (or polymer-specific) standard calibration curve.
- Run Parameters: Inject 100 µL of sample. Use a refractive index detector. Set flow rate to 1.0 mL/min. Column temperature at 35°C.
- Data Analysis: Calculate number-average (Mn), weight-average (Mw), and polydispersity index (PDI = Mw/Mn) using the instrument's software relative to the calibration curve.
2.3.2 Dimensional Analysis Protocol:
- Tools: Use a digital micrometer (accuracy ± 0.001 mm) for thickness/diameter and a digital caliper for length/width.
- Measurement: For rectangular specimens, measure length, width, and thickness at three distinct points along each dimension. For cylindrical specimens, measure diameter at three points and length.
- Calculation: Record the mean and standard deviation. Calculate initial volume (V₀) using appropriate geometric formulae.
2.3.3 Mass Analysis Protocol:
- Instrument: Use a calibrated analytical balance with a readability of at least 0.01 mg.
- Weighing: Weigh specimens in their conditioned (hydrated, patted-dry) state (mₕ) and after thorough vacuum-drying (m₀).
- Calculation: Determine the water uptake percentage at t=0: % Water Uptake = [(mₕ - m₀) / m₀] x 100.
3.0 Data Presentation: Summary of Quantitative Baseline Metrics
Table 1: Representative Initial Characterization Data for a Hypothetical PLGA 85:15 Specimen
| Characteristic | Measurement Method | Typical Value (Mean ± SD) | ASTM F1635-11 Relevance |
|---|---|---|---|
| Initial Dry Mass (m₀) | Analytical Balance | 100.50 ± 0.25 mg | Baseline for normalized mass loss (%) calculation. |
| Initial Hydrated Mass (mₕ) | Analytical Balance | 102.30 ± 0.30 mg | Starting point for in situ mass tracking. |
| Initial Water Uptake (%) | Calculated from m₀ & mₕ | 1.79 ± 0.15 % | Indicator of initial hydrophilicity/porosity. |
| Dimensions (Rectangular) | Digital Micrometer/Caliper | 10.00 x 5.00 x 2.00 mm ± 0.05 mm | Defines surface-area-to-volume ratio, a critical driver of degradation rate. |
| Initial Mw | Gel Permeation Chromatography | 95.5 ± 2.5 kDa | Critical baseline for tracking chain scission via hydrolysis. |
| Initial PDI | Gel Permeation Chromatography | 1.65 ± 0.05 | Indicates initial molecular weight distribution breadth. |
4.0 The Scientist's Toolkit: Research Reagent Solutions & Essential Materials
Table 2: Essential Materials for Pre-Test Preparation per ASTM F1635-11
| Item | Function / Rationale |
|---|---|
| Precision Die Cutter / CNC Mill | Ensures specimen dimensional consistency, minimizing inter-specimen variability in surface area and volume. |
| Fine-Grit Sandpaper (600-grit) | For deburring and smoothing edges to prevent stress concentrations and ensure uniform degradation. |
| Ultrasonic Cleaning Bath | For thorough, reproducible removal of machining contaminants and particles using solvent sequences. |
| High-Purity Solvents (Hexane, Ethanol) | Non-polar and polar solvents for effective, staged cleaning without swelling/degrading the polymer. |
| Vacuum Desiccator | For drying specimens to a constant mass at non-degradative temperatures prior to initial weighing. |
| Analytical Balance (± 0.01 mg) | Provides the precision required for accurate measurement of initial mass and subtle mass changes during degradation. |
| Digital Micrometer (± 0.001 mm) | Enables high-precision measurement of critical small dimensions (e.g., thickness) for volume/SA calculations. |
| pH-Meter & Buffering Salts | To prepare and verify the pH (7.4 ± 0.2) of the phosphate-buffered saline (PBS) degradation medium. |
| Degassing Chamber / Sonicator | To remove dissolved gases from PBS, preventing bubble formation on specimens during incubation. |
| GPC/SEC System with RI Detector | The gold-standard for quantifying initial molecular weight and tracking its change over time. |
| Polymer-Appropriate GPC Standards | (e.g., Polystyrene, PMMA) Essential for generating a calibration curve to determine absolute Mw. |
| 0.2 µm PTFE Syringe Filters | For filtering GPC sample solutions to prevent column contamination by particulates or gel particles. |
5.0 Visualized Workflows
Title: Pre-Test Sample Preparation and Characterization Workflow
Title: Gel Permeation Chromatography (GPC) Protocol Flow
ASTM F1635-11, “Standard Test Method for in Vitro Degradation Testing of Hydrolytically Degradable Polymer Resins and Fabricated Forms for Surgical Implants,” specifies the use of a simulated physiological fluid as an immersion medium to study mass loss and molecular weight changes. Phosphate Buffered Saline (PBS) at pH 7.4 is a ubiquitous choice due to its isotonicity, pH stability, and ionic composition mimicking extracellular fluid. This whitepaper details the rigorous preparation and standardization of PBS to ensure consistency and reproducibility in biomaterial degradation research, a critical prerequisite for generating reliable data compliant with ASTM F1635-11.
Preparation of 1X PBS (pH 7.4)
A standard 1X PBS solution contains 137 mM Sodium Chloride (NaCl), 10 mM Phosphate, and 2.7 mM Potassium Chloride (KCl). The following protocol is for preparing 1 liter.
Reagents:
- Sodium chloride (NaCl), molecular weight: 58.44 g/mol
- Potassium chloride (KCl), molecular weight: 74.55 g/mol
- Disodium hydrogen phosphate (Na₂HPO₄), molecular weight: 141.96 g/mol (anhydrous) or 177.99 g/mol (dihydrate)
- Potassium dihydrogen phosphate (KH₂PO₄), molecular weight: 136.09 g/mol
- Reagent-grade water (Type I, deionized)
- Hydrochloric acid (HCl), 1M solution (for pH adjustment)
- Sodium hydroxide (NaOH), 1M solution (for pH adjustment)
Protocol:
- Weighing: Accurately weigh the following salts and transfer to a 1L volumetric flask:
- 8.00 g of NaCl
- 0.20 g of KCl
- 1.44 g of Na₂HPO₄ (anhydrous) or 1.78 g of Na₂HPO₄·2H₂O
- 0.24 g of KH₂PO₄
- Dissolution: Add approximately 800 mL of deionized water to the flask and stir on a magnetic stirrer until all salts are completely dissolved.
- pH Adjustment: Measure the pH using a calibrated pH meter. The pH is typically near 7.4. If adjustment is required, use drops of 1M HCl to lower the pH or 1M NaOH to raise it. Stir thoroughly after each addition.
- Final Volume: Bring the final volume to 1.0 L with deionized water.
- Sterilization (if required): For degradation studies requiring aseptic conditions, filter-sterilize the solution using a 0.22 µm membrane filter into a sterile container. Autoclaving (121°C, 15 psi, 20 minutes) is an alternative but may cause precipitation in some formulations; filter sterilization is preferred.
- Storage: Store at room temperature or 4°C. Label with preparation date, pH, and molarity.
Standardization and Quality Control
For ASTM F1635-11 compliance, the immersion medium must be characterized. The following parameters should be verified.
Table 1: Standardization Parameters for PBS (pH 7.4)
| Parameter | Target Specification | Test Method | Acceptable Range |
|---|---|---|---|
| pH | 7.40 | Potentiometry using calibrated pH meter | 7.35 - 7.45 |
| Osmolality | ~290 mOsm/kg | Freezing-point depression osmometer | 285 - 310 mOsm/kg |
| Conductivity | ~15.9 mS/cm (25°C) | Conductivity meter | 15.0 - 16.5 mS/cm |
| Absence of Contaminants | Visual clarity | Visual inspection | Clear, colorless, particle-free |
Experimental Protocol for Osmolality Measurement:
- Calibrate the osmometer using standard solutions per manufacturer instructions.
- Pipette 50 µL of the prepared PBS into a clean sample cup.
- Lower the measuring probe and initiate the reading.
- Record the value in mOsm/kg. Perform in triplicate.
Application as an Immersion Medium in ASTM F1635-11
The standard specifies immersion in a controlled buffer at 37°C. PBS serves as the hydrolytic medium, and its standardization is crucial for inter-laboratory comparison.
Experimental Protocol for Degradation Testing (Excerpt):
- Sample Preparation: Pre-weigh (W₀) and dimensionally characterize test specimens (e.g., discs, films).
- Immersion: Place each specimen in a sealed container with a defined volume of PBS (e.g., 20 mL per 100 mg polymer) to ensure sufficient sink conditions.
- Incubation: Place containers in a forced-air oven or water bath maintained at 37.0 ± 1.0°C for the duration of the study (e.g., 1, 3, 6, 12 months).
- Medium Management: The PBS immersion medium should be replaced periodically (e.g., weekly) to maintain pH and ion concentration, as degradation products can alter the local environment.
- Analysis: At designated time points, remove specimens, rinse, dry under vacuum, and analyze for mass loss (Wₜ), molecular weight (GPC), and visual/microscopic changes.
Logical Workflow for PBS Preparation & Use in ASTM Testing
The Scientist's Toolkit: Research Reagent Solutions for PBS & Degradation Studies
Table 2: Essential Materials for PBS Preparation and ASTM F1635-11 Testing
| Item | Function in Protocol | Key Consideration |
|---|---|---|
| Analytical Balance | Precise weighing of salts (mg to g range). | Calibration and precision (±0.1 mg) are critical for molarity accuracy. |
| pH Meter with Electrode | Accurate measurement and adjustment of solution pH. | Requires daily calibration with pH 4.01, 7.00, and 10.01 buffers. |
| Class A Volumetric Flasks | Precise volumetric preparation of solutions. | Ensures final concentration accuracy; use at stated temperature (usually 20°C). |
| Osmometer | Measures solution osmolarity to confirm isotonicity. | Critical for ensuring physiological relevance; requires regular calibration. |
| 0.22 µm PES Membrane Filter | Sterilization of PBS without autoclave-induced precipitation. | Preserves ionic composition; essential for long-term sterile studies. |
| Water Bath or Forced-Air Oven | Maintains immersion medium at 37.0 ± 1.0°C per ASTM. | Forced-air ovens minimize evaporation and condensation issues in sealed vessels. |
| Anhydrous vs. Dihydrate Salts | Source of phosphate and sodium ions. | Must be specified in SOPs; molecular weight differences affect weighing calculations. |
ASTM F1635-11, "Standard Test Method for in vitro Degradation Testing of Hydrolytically Degradable Polymer Resins and Fabricated Forms for Surgical Implants," mandates strict control of incubation conditions to ensure the reproducibility and physiological relevance of biomaterial degradation studies. Central to this standard is the maintenance of a stable temperature of 37°C ± 1°C, simulating human physiological conditions, and rigorous aseptic technique to prevent microbial contamination. Contamination can drastically alter local pH, introduce foreign enzymes, and confound mass loss, molecular weight, and mechanical property measurements, rendering data non-compliant with the standard. This guide details the technical implementation of these two pillars for research aligned with ASTM F1635-11.
The Imperative of Temperature Control (37°C ± 1°C)
Precise temperature maintenance is not merely a convenience; it is a kinetic necessity. Hydrolytic degradation rates of polymers like PLGA, PLLA, and PGA are governed by Arrhenius kinetics, where a 1°C deviation can lead to a measurable change in degradation rate, potentially shifting timepoints for critical data collection.
Table 1: Impact of Temperature Variation on Degradation Kinetics of Common Biomaterials
| Polymer | Degradation Mechanism | Approximate Q₁₀ (Rate change per 10°C) | Estimated Rate Change per +1°C |
|---|---|---|---|
| PLGA (50:50) | Bulk Erosion (Hydrolysis) | ~2.0 | ~7% increase |
| PLLA | Surface/Bulk Erosion | ~1.8 | ~6% increase |
| Collagen | Enzymatic & Hydrolytic | ~1.5 - 2.5 | ~5-9% increase |
| PGA | Bulk Erosion (Hydrolysis) | ~2.2 | ~8% increase |
Note: Q₁₀ is a measure of the rate of change of a biological or chemical system as a consequence of increasing the temperature by 10°C.
Experimental Protocol: Validating Incubator Performance
Objective: To map and verify the temperature uniformity and stability within an incubation chamber used for ASTM F1635-11 testing.
Materials:
- Calibrated, multi-channel data logger with NIST-traceable temperature probes.
- Incubator (forced-air circulation recommended over water-jacketed for uniformity).
- Rack or platform to hold probes in positions simulating sample locations.
Methodology:
- Place a minimum of 9 temperature probes within the incubator: each corner, the center, and midpoints of walls.
- Set the incubator to 37.0°C and allow to equilibrate for 24 hours.
- Record temperature from all probes at 1-minute intervals for a minimum of 24 hours.
- Analysis: Calculate the mean temperature, standard deviation, and the range (max-min) for each probe location and for the entire chamber. The system is compliant if all recorded points fall within 37°C ± 1°C and the spatial variation is less than 0.5°C.
Principles and Execution of Aseptic Technique
Aseptic technique encompasses all procedures to prevent contamination by microorganisms (bacteria, fungi, mycoplasma) and unintended cross-contamination between samples.
Core Aseptic Protocols for Degradation Studies
A. Media/Buffer Preparation & Sterilization:
- Use USP Type I water.
- Filter-sterilize (0.22 µm pore size) all solutions into sterile containers. Autoclaving (121°C, 15 psi, 20 min) is acceptable for phosphate buffers, but may degrade some sensitive polymers or additives.
- Validate sterility by incubating an aliquot of each batch at 37°C for 48 hours prior to use.
B. Sample Handling and Incubation:
- Perform all manipulations in a Class II Biosafety Cabinet (BSC) validated within the last 12 months.
- Use sterile forceps and tools. Sterilize tools by 70% ethanol immersion and flaming, allowing to cool completely before contacting samples.
- Change gloves frequently and disinfect with 70% ethanol.
- Use sterile, single-use containers. If reusing containers, clean rigorously and sterilize by autoclaving.
- Seal containers (e.g., screw-cap vials) tightly to prevent evaporation and contamination ingress.
- Include negative controls (media alone, no sample) in every experiment to monitor for contamination.
C. Regular Monitoring:
- Visually inspect samples weekly for cloudiness, biofilm, or pH indicator color change.
- Periodically plate media samples on LB agar and Sabouraud dextrose agar to test for bacterial and fungal contamination, respectively.
Integrated Experimental Workflow for ASTM F1635-11 Compliance
Diagram Title: ASTM F1635-11 Degradation Study Workflow
Contamination Impact Pathway
Diagram Title: Impact of Contamination on Degradation Data
The Scientist's Toolkit: Essential Research Reagent Solutions
Table 2: Key Reagents & Materials for Compliant Degradation Studies
| Item | Function in ASTM F1635-11 Context | Critical Specification/Note |
|---|---|---|
| USP Type I Water | Solvent for all immersion media (e.g., PBS). | Must be endotoxin/pyrogen-free to avoid inflammatory confounding. |
| Phosphate Buffered Saline (PBS), pH 7.4 | Standard immersion medium for hydrolytic degradation. | Filter sterilized (0.22 µm); contains antimicrobials (e.g., NaN₃ 0.02%) only if justified and reported. |
| Simulated Body Fluid (SBF) | Alternative immersion medium for bioresorbable ceramics or composites. | Ion concentrations approximate to human blood plasma. Must be filter-sterilized, not autoclaved. |
| 70% Ethanol Solution | Primary disinfectant for BSC surfaces, tools, and gloves. | More effective than higher concentrations at penetrating cell walls. |
| Sterile, Single-Use Specimen Containers | Holds sample and immersion medium. | Polypropylene or chemically inert material; must not adsorb degradation products. |
| Calibrated pH Meter | Weekly monitoring of immersion media pH. | Crucial for detecting microbial contamination (acidic shift) or polymer degradation effects. |
| NIST-Traceable Thermometer | Validating incubator setpoint and uniformity. | Required for the pre-study validation protocol. |
| Sterile Surgical Tools (Forceps, Scissors) | Handling sterile polymer samples. | Must be cleaned and sterilized (autoclave/ethylene oxide) between timepoints to prevent carryover. |
This guide frames time-point strategy within the rigorous framework of ASTM F1635-11, Standard Test Method for *in vitro Degradation Testing of Hydrolytically Degradable Polymer Resins and Fabricated Forms for Surgical Implants*. The standard provides essential guidance but intentionally avoids prescribing a universal sampling schedule. The broader thesis posits that a scientifically-justified time-point strategy is the critical link between standardized methodology and the generation of meaningful, predictive degradation profiles for biomaterials in drug development and implant research. A poorly designed schedule risks missing key transition points, leading to erroneous conclusions about mass loss, molecular weight decline, and release kinetics of incorporated agents.
Core Principles of Time-Point Selection
Effective scheduling transcends arbitrary or calendar-based choices. It is a hypothesis-driven design process based on the material's known properties and the study's objectives.
- Degradation Mechanism: Hydrolytic (bulk vs. surface erosion), enzymatic, oxidative. Bulk-eroding polymers (e.g., PLGA) often exhibit a lag phase followed by rapid loss of properties.
- Initial Material Properties: Starting molecular weight, crystallinity, porosity, and device geometry.
- Expected Kinetic Model: Zero-order, first-order, or more complex models (e.g., autocatalytic).
- Critical Transition Points: The time to onset of mass loss, the point of 50% mass loss, and the complete degradation time are key milestones.
Quantitative Data and Published Sampling Frameworks
Recent literature and standards analysis support a non-linear, staged approach. The table below synthesizes recommendations for a typical 6-12 month study of a bulk-eroding polymer like PLGA.
Table 1: Recommended Staged Time-Point Strategy for Bulk-Eroding Polymers
| Study Phase | Primary Objective | Recommended Frequency | Key Metrics | Rationale |
|---|---|---|---|---|
| Phase 1: Early (0-2 weeks) | Monitor hydration, initial swelling, & early molecular weight (Mw) drop. | Every 24-72 hours | Water uptake, pH of medium, Mw (GPC) | Capture the initial burst release (if drug-loaded) and the onset of hydrolysis. |
| Phase 2: Mid (2-8 weeks) | Track steady-state degradation & property loss. | Weekly to Bi-weekly | Mass loss, Mw, mechanical properties (e.g., tensile strength) | Observe the linear or pseudo-linear phase of degradation before autocatalytic effects dominate. |
| Phase 3: Transition (8-16 weeks) | Identify onset of accelerated mass loss & structural failure. | Every 10-14 days | Mass loss, visual integrity, monomer release (HPLC) | Critical phase where bulk erosion leads to rapid changes. Increased sampling density captures the inflection point. |
| Phase 4: Final (16+ weeks) | Document complete resorption or plateau. | Monthly until endpoint >80% mass loss or plateau | Residual mass, solution analysis | Confirm final degradation products and ensure study captures the endpoint. |
Table 2: Impact of Sampling Density on Data Fidelity (Simulated PLGA Study)
| Time-Point Strategy | Total Time-Points | Inflection Point Detected? | Error in T50 Estimate | Ability to Model Kinetic Order |
|---|---|---|---|---|
| Sparse Linear (Monthly) | 6 | No | > ±4 weeks | Poor (R² < 0.85) |
| Staged, High-Resolution | 15-20 | Yes | < ±1 week | Excellent (R² > 0.95) |
| ASTM F1635-11 Minimum* | 5 | Very Unlikely | Highly Variable | Insufficient |
*ASTM F1635-11 suggests a minimum of five data points for a molecular weight vs. time plot but emphasizes more points are needed to define the curve.
Experimental Protocols for Key Degradation Analyses
Protocol 1: Mass Loss and Water Uptake (Per ASTM F1635-11)
- Sample Preparation: Pre-weigh (Wdry, initial) sterile specimens (n≥5 per time point).
- Immersion: Incubate in phosphate-buffered saline (PBS) at 37°C ± 1°C in sealed containers.
- Sampling: Retrieve specimens per designed schedule. Rinse with deionized water and blot dry.
- Wet Weight: Immediately weigh to obtain wet weight (Wwet).
- Dry Weight: Lyophilize to constant weight (Wdry, final).
- Calculation:
- Mass Loss %: = [(Wdry, initial - Wdry, final) / Wdry, initial] x 100
- Water Uptake %: = [(Wwet - Wdry, final) / Wdry, final] x 100
Protocol 2: Gel Permeation Chromatography (GPC) for Molecular Weight
- Sample Preparation: At each time point, dissolve degraded polymer specimens in appropriate tetrahydrofuran (THF) or chloroform.
- Filtration: Filter through 0.2 µm PTFE filter to remove particulates.
- GPC Analysis: Use HPLC system with refractive index detector and series of polystyrene or PLGA-calibrated columns.
- Data Analysis: Report weight-average molecular weight (Mw), number-average molecular weight (Mn), and polydispersity index (PDI).
Protocol 3: Medium Analysis for Degradation Products
- Medium Collection: At each time point and with each medium change, retain and archive the degradation medium.
- pH Monitoring: Measure pH directly using a calibrated micro-electrode.
- Monomer/Product Analysis: Quantify lactic and glycolic acid monomers (or other relevant products) using High-Performance Liquid Chromatography (HPLC) with UV or charged aerosol detection.
Visualizing the Strategy and Degradation Cascade
The Scientist's Toolkit: Research Reagent Solutions
Table 3: Essential Materials for in vitro Degradation Testing
| Item | Function / Rationale | Example / Specification |
|---|---|---|
| Phosphate Buffered Saline (PBS), pH 7.4 | Simulates physiological ionic strength and pH. Must be sterile to prevent microbial confounding. | 1X, 0.01M phosphate, 0.0027M KCl, 0.137M NaCl. Sterile filtered (0.22 µm). |
| Sodium Azide or Antibiotic/Antimycotic | Biostatic agent to prevent microbial growth during long-term immersion studies. | 0.02% w/v Sodium Azide or 1% v/v Antibiotic-Antimycotic solution. |
| Tetrahydrofuran (THF), HPLC Grade | Primary solvent for GPC analysis of many polyesters (e.g., PLGA, PCL). Must be stabilized. | HPLC grade, stabilized with BHT. Stored over molecular sieves. |
| Polystyrene or PLGA GPC Standards | Calibrates GPC system for accurate molecular weight determination of unknown samples. | Narrow dispersity standards covering expected Mw range (e.g., 1 kDa – 500 kDa). |
| Lactic & Glycolic Acid Standards | Reference standards for quantifying degradation products in medium via HPLC. | USP/PhEur grade for accurate calibration curve generation. |
| 0.22 µm PTFE Syringe Filters | For sterilizing buffers and filtering polymer solutions prior to GPC injection. | Hydrophobic PTFE prevents adsorption of aqueous analytes. |
| pH Calibration Buffer Solutions | Ensures accuracy of pH monitoring, critical for detecting autocatalytic effects. | Certified buffers at pH 4.01, 7.00, and 10.01 at 25°C. |
| Inert Sealed Vials/Containers | Prevents evaporation of medium and contamination during incubation. | Polypropylene containers with silicone gasket seals. |
Within the rigorous framework of biomaterial degradation testing, as standardized by ASTM F1635-11, "Standard Test Method for in vitro Degradation Testing of Hydrolytically Degradable Polymer Resins and Fabricated Forms for Surgical Implants," the processes of sample retrieval, cleaning, drying, and weighing are critical for generating reliable and reproducible data. This in-depth technical guide details the protocols essential for accurate mass loss determination, a primary metric in assessing the degradation profile of polymeric biomaterials intended for temporary implant applications. Proper execution of these steps minimizes experimental error and ensures alignment with the standard's emphasis on precision and consistency in a simulated physiological environment.
Protocols Within the ASTM F1635-11 Framework
ASTM F1635-11 specifies the use of a phosphate-buffered saline (PBS) solution, often at pH 7.4 and 37°C, to simulate in vivo conditions. The standard mandates periodic retrieval of samples to monitor changes in mass and physical properties over time. The following protocols are designed to comply with and operationalize the standard's requirements.
Sample Retrieval Protocol
Objective: To safely and consistently remove test samples from the degradation medium at predetermined time points without introducing contamination or mechanical damage.
Methodology:
- Preparation: Pre-label sterile, chemically inert containers (e.g., polypropylene) for each sample. Use forceps with non-crushing tips.
- Retrieval: Using the sterile forceps, gently remove each test specimen from its incubation vessel. Allow excess immersion medium to drip off briefly back into the original container.
- Rinse Initiation: Immediately place the sample into a container filled with a pre-warmed (37°C) deionized (DI) water or ultrapure water rinse solution to halt ongoing hydrolytic reactions.
- Documentation: Note any macroscopic changes in sample integrity, shape, or color upon retrieval.
Cleaning Protocol
Objective: To remove all soluble degradation products, residual salts (e.g., PBS crystals), and loosely adherent oligomers or debris from the sample surface without dissolving or damaging the degrading polymer matrix.
Methodology:
- Primary Rinse: Agitate the sample in its first container of DI water for 5 minutes. For fragile samples, gentle orbital shaking is preferred.
- Sequential Rinsing: Transfer the sample to a second, fresh container of DI water for an additional 5-minute rinse. For highly porous materials or those with significant degradation, a third rinse may be necessary.
- Validation: Conduct a conductivity check on the final rinse solution. A reading near that of pure DI water (<5 µS/cm) indicates effective salt removal. If conductivity is high, repeat rinsing until acceptable levels are achieved.
- Special Cases: For samples with persistent adherent deposits, low-power ultrasonic cleaning in DI water for 30-60 seconds may be employed, provided it does not cause fragmentation.
Drying Protocol
Objective: To remove all absorbed and adsorbed water from the sample to achieve a constant, stable dry mass.
Methodology:
- Blotting (Optional): For samples with large surface water droplets, gently blot with a lint-free, low-residue laboratory wipe. Avoid abrasive contact.
- Primary Drying: Place samples in a clean, controlled environment. The most common and standardized method is vacuum drying.
- Equipment: Vacuum oven or desiccator connected to a vacuum pump.
- Conditions: Desiccant (e.g., phosphorus pentoxide, silica gel) must be present. A moderate temperature, typically 37°C to 50°C (below the polymer's glass transition temperature), is used to accelerate water removal without inducing thermal degradation.
- Procedure: Apply a vacuum of ≤100 mTorr (13.3 Pa). Dry until constant mass is achieved.
- Constant Mass Verification: Weigh the sample at 24-hour intervals. Constant mass is defined as a mass change of less than 0.1 mg between two consecutive weighings, separated by at least 24 hours of further drying.
Weighing Protocol
Objective: To obtain an accurate and precise measurement of the sample's dry mass at each time point.
Methodology:
- Equipment: Use a calibrated analytical microbalance with a readability of at least 0.01 mg (0.00001 g). Ensure it is placed on a vibration-isolated table in a draft-free, temperature-stable environment.
- Conditioning: After drying, allow the sample to cool to room temperature in the desiccator to prevent moisture condensation and convection currents from affecting the balance.
- Weighing Procedure:
- Tare the balance with an empty, clean weighing boat or dish.
- Using anti-static tools and gloves, quickly transfer the sample to the boat and record the mass.
- Return the sample to the desiccator and repeat the weighing process. The two measurements should agree within the balance's repeatability specification (±0.02 mg is typical for a 0.01 mg balance). Record the average.
Data Presentation
Table 1: Summary of Critical Protocol Parameters from Current Best Practices
| Protocol Step | Key Parameter | Recommended Specification | Rationale |
|---|---|---|---|
| Cleaning | Rinse Solution | Deionized Water, 18.2 MΩ·cm | Minimizes ionic contamination. |
| Cleaning | Rinse Validation | Final Rinse Conductivity <5 µS/cm | Ensures complete salt removal. |
| Drying | Environment | Vacuum ≤100 mTorr (13.3 Pa) | Lowers boiling point of water for efficient removal. |
| Drying | Temperature | 37°C - 50°C (Polymer dependent) | Accelerates drying without thermal stress. |
| Drying | Constant Mass Criterion | ΔMass < 0.1 mg over 24h | Ensures complete water removal for mass stability. |
| Weighing | Balance Readability | ≤ 0.01 mg (0.00001 g) | Sufficient sensitivity for detecting small mass changes. |
| Weighing | Environmental Control | Draft shield, vibration isolation, stable temperature | Eliminates sources of weighing error. |
Table 2: Example Mass Loss Calculation (Theoretical Data)
| Time Point (Weeks) | Initial Dry Mass (mg) | Retrieved Dry Mass (mg) | Mass Loss (mg) | Percent Mass Loss (%) |
|---|---|---|---|---|
| 0 | 100.00 | 100.00 | 0.00 | 0.00 |
| 4 | 100.00 | 98.45 | 1.55 | 1.55 |
| 12 | 100.00 | 94.32 | 5.68 | 5.68 |
| 24 | 100.00 | 87.11 | 12.89 | 12.89 |
Experimental Workflow Visualization
Title: Sample Processing Workflow for ASTM F1635-11 Mass Loss
The Scientist's Toolkit
Table 3: Essential Research Reagent Solutions and Materials
| Item | Function/Description |
|---|---|
| Phosphate-Buffered Saline (PBS), pH 7.4 | The standard immersion medium per ASTM F1635-11, simulating physiological ionic strength and pH to drive hydrolytic degradation. |
| Deionized (DI) Water, 18.2 MΩ·cm | High-purity rinse solution for removing PBS salts and soluble degradation products without introducing contaminants. |
| Vacuum Oven / Desiccator | Provides a controlled, low-humidity, and optionally heated environment for achieving constant dry mass. |
| Phosphorus Pentoxide (P₂O₅) or Silica Gel | Powerful desiccant used within the drying vessel to chemically scavenge residual water vapor. |
| Analytical Microbalance (0.01 mg readability) | Precision instrument required to detect the subtle mass changes indicative of early-stage polymer degradation. |
| Anti-Static Tools & Gloves | Prevents static charge buildup on samples and weighing vessels, which can cause significant weighing errors. |
| Lint-Free, Low-Residue Wipes | For gentle blotting of samples; minimizes particulate contamination. |
| Conductivity Meter | Validates the efficacy of the cleaning protocol by confirming the absence of ionic residues in the final rinse. |
| Chemically Inert Containers (e.g., Polypropylene) | For sample storage and rinsing; prevents leaching or adsorption of materials that could affect mass. |
| Non-Crushing, Sterile Forceps | Allows for safe, aseptic handling of samples to prevent contamination or physical damage. |
The ASTM F1635-11 standard, "Standard Test Method for in vitro Degradation Testing of Hydrolytically Degradable Polymer Resins and Fabricated Forms for Surgical Implants," provides a critical framework for assessing the performance and safety of absorbable polymeric biomaterials. Within this framework, the measurement of specific key analytical endpoints—mass loss, molecular weight change, and visual/morphological alterations—is paramount for understanding degradation kinetics, mechanism, and biocompatibility. This whitepaper provides an in-depth technical guide on executing and interpreting these core measurements, contextualized within the rigorous requirements of ASTM F1635-11 to support robust research and regulatory submissions in drug development and medical device innovation.
Core Analytical Endpoints: Methodologies and Protocols
Mass Loss Measurement
Mass loss is the most direct indicator of polymer degradation, reflecting the erosion of material from the bulk specimen as oligomers and monomers are released into the surrounding medium.
Experimental Protocol (per ASTM F1635-11 Guidance):
- Specimen Preparation: Precisely cut or mold polymer samples to known dimensions (e.g., discs, films). ASTM F1635 recommends a minimum of three replicates per time point.
- Initial Drying & Weighing (M₀): Dry specimens to constant weight in a vacuum desiccator. Record the initial dry mass (M₀) using a high-precision analytical balance (±0.01 mg).
- Immersion in Buffer: Immerse specimens in a controlled degradation medium (typically phosphate-buffered saline, PBS, pH 7.4 ± 0.1) at 37°C ± 1°C. The standard specifies a recommended volume-to-surface area ratio.
- Time-Point Sampling: Remove replicates at predetermined intervals (e.g., 1, 3, 6, 12, 24 weeks).
- Recovery & Final Weighing (Mₜ): Rinse retrieved specimens with deionized water, dry to constant weight under the same initial conditions, and record the final dry mass (Mₜ).
- Calculation: Percent Mass Loss =
[(M₀ - Mₜ) / M₀] * 100.
Table 1: Example Mass Loss Data for Poly(L-lactide) (PLLA) in PBS at 37°C
| Time Point (Weeks) | Average Initial Mass, M₀ (mg) | Average Final Mass, Mₜ (mg) | Mass Loss (%) ± SD |
|---|---|---|---|
| 0 | 50.00 | 50.00 | 0.0 ± 0.0 |
| 12 | 50.10 | 48.95 | 2.3 ± 0.5 |
| 24 | 49.95 | 45.62 | 8.7 ± 0.9 |
| 48 | 50.05 | 38.14 | 23.8 ± 1.3 |
Molecular Weight Analysis via Gel Permeation Chromatography (GPC)
GPC (or Size Exclusion Chromatography, SEC) is the principal method for monitoring the reduction in polymer chain length, which precedes and dictates mass loss.
Detailed GPC Protocol:
- Sample Preparation: At each degradation time point, dissolve a portion of the retrieved (and dried) specimen in an appropriate chromatographic solvent (e.g., tetrahydrofuran, THF, for polyesters). Filter through a 0.2 μm PTFE syringe filter.
- System Calibration: Use narrow dispersity polystyrene (PS) or, ideally, polymethyl methacrylate (PMMA) standards to create a calibration curve of log(Molecular Weight) vs. elution time.
- Chromatography: Inject sample into the GPC system (isocratic pump, columns, refractive index detector). Use a column set suitable for the expected molecular weight range.
- Data Analysis: Calculate the number-average molecular weight (Mₙ), weight-average molecular weight (M𝓌), and dispersity (Đ = M𝓌/Mₙ). Normalized Mₙ is the key metric:
(Mₙ at time t / Mₙ initial) * 100.
Table 2: Example GPC Data for Degrading Poly(D,L-lactide-co-glycolide) (PLGA 50:50)
| Time Point (Weeks) | Mₙ (kDa) ± SD | M𝓌 (kDa) ± SD | Dispersity (Đ) | Normalized Mₙ (%) |
|---|---|---|---|---|
| 0 (Initial) | 95.2 ± 2.1 | 178.5 ± 3.8 | 1.87 | 100.0 |
| 4 | 42.3 ± 1.8 | 65.1 ± 2.5 | 1.54 | 44.4 |
| 8 | 12.5 ± 0.9 | 16.8 ± 1.1 | 1.34 | 13.1 |
| 12 | < 5 kDa | < 8 kDa | - | < 5.3 |
Visual and Morphological Assessment
Qualitative and quantitative imaging provides context for bulk measurements, revealing surface erosion, bulk erosion, cracking, pore formation, and fragmentation.
Protocol for Multi-Scale Imaging:
- Macrophotography: Document specimens against a scale bar at each time point using a standardized lighting setup to track gross changes in size, shape, and opacity.
- Scanning Electron Microscopy (SEM):
- Sample Preparation: Critical-point dry specimens to prevent collapse of hydrated structures. Sputter-coat with a thin layer of gold/palladium for conductivity.
- Imaging: Acquire micrographs at various magnifications (e.g., 100x, 1000x, 5000x) to visualize surface pitting, pore interconnectivity, and internal morphology (from fractured cross-sections).
- Data Recording: Systematically document observations (e.g., "onset of surface porosity at 8 weeks," "significant cracking and fragmentation at 24 weeks").
The Scientist's Toolkit: Essential Research Reagent Solutions
Table 3: Key Materials and Reagents for ASTM F1635-11 Compliant Degradation Studies
| Item/Reagent | Function & Rationale |
|---|---|
| High-Purity PBS Buffer (pH 7.4) | Simulates physiological ionic strength and pH; contains no antimicrobial agents that could interfere with hydrolytic degradation. |
| 0.22 μm Sterile Filters | For filtering and sterilizing degradation buffers to prevent microbial contamination, which would confound hydrolytic mass loss data. |
| Vacuum Desiccator with Drierite | Provides a standardized, moisture-free environment for drying specimens to constant weight before mass measurement. |
| HPLC-Grade Tetrahydrofuran (THF) | Common solvent for GPC analysis of many degradable polyesters (e.g., PLA, PLGA, PCL); must be stabilized and free of peroxides. |
| Narrow Dispersity Polystyrene Standards | Essential for calibrating the GPC system to convert elution volume to molecular weight. |
| Critical Point Dryer | Preserves the native microstructure of hydrated/degrading polymers for SEM analysis by replacing water with liquid CO₂, then removing it above its critical point. |
| Sputter Coater | Applies a nanometer-thick conductive metal layer (Au/Pd) to non-conductive polymer samples for high-resolution SEM imaging. |
| PTFE Syringe Filters (0.2 μm) | For filtering dissolved polymer samples prior to GPC injection, protecting columns from particulates. |
Experimental Workflow and Data Relationship Diagrams
Diagram Title: Integrated Workflow for Polymer Degradation Analysis
Diagram Title: Causal Chain of Polymer Degradation Events
The standard test method ASTM F1635-11: Standard Test Method for in Vitro Degradation Testing of Hydrolytically Degradable Polymer Resins and Fabricated Forms for Surgical Implants provides a critical framework for evaluating the degradation of polymeric biomaterials intended for medical use. This whitepaper details the core calculations—percent mass loss and molecular weight retention—that are fundamental to interpreting degradation kinetics as per this standard. These quantitative metrics are essential for researchers, scientists, and drug development professionals to predict implant performance, drug release profiles from resorbable carriers, and overall biocompatibility in a physiological environment.
Core Formulas and Definitions
The degradation of hydrolytically labile polymers (e.g., PLGA, PLLA) is primarily tracked through physical mass loss and the reduction in polymer chain length.
Percent Mass Loss (%ML)
Percent Mass Loss quantifies the physical erosion of the polymer specimen due to the dissolution of oligomeric and monomeric degradation products into the incubation medium.
Formula:
% Mass Loss = [(W₀ - W_d) / W₀] × 100
Where:
W₀= Initial dry mass of the specimen before degradation (mg or g).W_d= Dry mass of the specimen after a specific degradation time periodt(mg or g).
Interpretation: A steady increase in %ML over time indicates progressive bulk erosion.
Molecular Weight Retention (MWR%)
Molecular Weight Retention reflects the extent of chain scission (hydrolysis of ester bonds) within the polymer, which precedes and informs eventual mass loss. It is typically measured via Gel Permeation Chromatography (GPC).
Formula:
% MWR = (M_n(t) / M_n(0)) × 100
Alternatively, using weight-average molecular weight:
% MWR_Mw = (M_w(t) / M_w(0)) × 100
Where:
M_n(0)= Initial number-average molecular weight before degradation.M_n(t)= Number-average molecular weight after degradation timet.M_w(0)= Initial weight-average molecular weight.M_w(t)= Weight-average molecular weight after timet.
Critical Note: The specific molecular weight average (M_n or M_w) used must be consistently reported and compared. M_n is more sensitive to chain scission events.
Data Presentation: Typical Degradation Profile
The following table summarizes hypothetical but representative data for a 50:50 PLGA film degraded in phosphate-buffered saline (PBS) at 37°C, as might be collected in an ASTM F1635-11 compliant study.
Table 1: Degradation Timeline for 50:50 PLGA (Initial M_n = 80 kDa)
| Degradation Time (Weeks) | Mass Retention (%) | Mass Loss (%) | M_n (kDa) | MWR (%) (by M_n) | Polydispersity Index (PDI) |
|---|---|---|---|---|---|
| 0 | 100.0 | 0.0 | 80.0 | 100.0 | 1.8 |
| 2 | 99.5 | 0.5 | 65.2 | 81.5 | 2.0 |
| 4 | 98.8 | 1.2 | 45.1 | 56.4 | 2.3 |
| 8 | 92.1 | 7.9 | 22.4 | 28.0 | 2.8 |
| 12 | 75.3 | 24.7 | 10.5 | 13.1 | 3.1 |
| 16 | 41.2 | 58.8 | N/D* | N/D* | N/D* |
*N/D: Not determinable due to significant mass loss and fragmentation.
Experimental Protocol: In Vitro Hydrolytic Degradation per ASTM F1635-11
Objective: To determine the mass loss and molecular weight retention of a polymeric biomaterial under simulated physiological conditions.
Materials: See "The Scientist's Toolkit" below.
Methodology:
Specimen Preparation:
- Fabricate polymer specimens into standardized forms (e.g., disks, films) with precise dimensions.
- Initial Drying: Vacuum-dry specimens to constant weight at room temperature (or a specified temperature below Tg) to remove residual solvent and moisture. Record this as
W₀. - Initial Molecular Weight: Characterize a representative sample via GPC to determine
M_n(0)andM_w(0).
Degradation Incubation:
- Aseptically place individual specimens in vials containing a pre-warmed (37°C) degradation medium (e.g., PBS, pH 7.4).
- Maintain a standard buffer volume-to-surface area ratio (e.g., 1 mL per 1 cm² as suggested by the standard).
- Incubate vials in a controlled environment (37°C ± 1°C) without agitation or with controlled agitation.
- For each time point
t(e.g., 1, 2, 4, 8, 12 weeks), prepare and incubate a separate set of specimen vials (n ≥ 3).
Post-Incubation Analysis:
- Rinsing & Drying: At time
t, remove specimens from medium. Rinse gently with deionized water to remove buffer salts. Vacuum-dry to constant weight. Record asW_d. - Mass Measurement: Calculate % Mass Loss using the formula in Section 2.1.
- Molecular Weight Analysis: Dissolve the dried specimen in an appropriate GPC solvent (e.g., THF for PLGA). Filter to remove any insoluble residues. Analyze via GPC to determine
M_n(t)andM_w(t). Calculate % MWR.
- Rinsing & Drying: At time
Medium Analysis (Supplementary): The pH of the degradation medium should be monitored at each change interval, as autocatalysis is indicated by a drop in pH.
Visualizing the Degradation Workflow and Pathways
Title: Hydrolytic Degradation Pathway of Polymers
Title: ASTM F1635-11 Degradation Testing Workflow
The Scientist's Toolkit: Key Research Reagent Solutions
Table 2: Essential Materials for Hydrolytic Degradation Studies
| Item | Function & Specification |
|---|---|
| Polymer Specimens | Test material (e.g., PLGA, PLLA) fabricated into standardized forms (films, disks) with known initial properties. |
| Phosphate Buffered Saline (PBS), pH 7.4 | Standard aqueous degradation medium to simulate physiological ionic strength and pH. Must be sterile and contain 0.02% sodium azide to inhibit microbial growth in long-term studies. |
| Vacuum Desiccator | Used for drying specimens to a constant weight before and after incubation. Must be capable of maintaining a deep vacuum (< 0.1 mBar) at room temperature. |
| Analytical Microbalance | High-precision balance (accuracy ± 0.01 mg) for measuring initial (W₀) and degraded (W_d) dry masses. |
| Gel Permeation Chromatography (GPC) System | Equipped with refractive index (RI) and multi-angle light scattering (MALS) detectors for accurate absolute molecular weight (M_w, M_n) and PDI determination. |
| GPC Solvent (e.g., HPLC-grade THF with BHT stabilizer) | Mobile phase for dissolving polymer samples for GPC analysis. Must be stabilized to prevent peroxide formation. |
| Polystyrene or PMMA Standards | Narrow molecular weight standards for calibrating the GPC system if absolute detection (MALS) is not available. |
| 0.22 µm PTFE Syringe Filters | For filtering dissolved polymer solutions prior to GPC injection to remove particulates or gel particles. |
| pH Meter | For regular monitoring of the degradation medium pH at each change interval to track autocatalytic effects. |
Overcoming Common Challenges: Troubleshooting and Optimizing Your ASTM F1635-11 Assays
This technical guide, framed within the context of research on biomaterial degradation testing per ASTM F1635-11 Standard Test Method for in vitro Degradation Testing of Hydrolytically Degradable Polymer Resins and Fabricated Forms for Surgical Implants, details critical experimental pitfalls that can compromise data integrity. Adherence to the standard’s framework is assumed, with a focus on often-overlooked practical challenges.
pH Stability in Degradation Media
ASTM F1635-11 specifies the use of phosphate-buffered saline (PBS) or other appropriate buffers incubated at 37±1°C. A primary pitfall is the loss of pH stability, which dramatically alters hydrolytic degradation kinetics.
Pitfall Mechanism: Degradation of poly(lactic-co-glycolic acid) (PLGA) and similar aliphatic polyesters releases acidic monomers (lactic and glycolic acid), locally overwhelming the buffer capacity of standard PBS (typically 10-50 mM). This creates an autocatalytic effect, accelerating interior degradation.
Experimental Protocol for Monitoring pH Stability:
- Setup: Prepare degradation medium per ASTM F1635-11 (e.g., pH 7.4 ± 0.2 PBS). Immerse test specimens (n≥3) in sealed containers.
- Control: Include vials containing only medium (no specimen) and vials with non-degradable control specimens (e.g., PMMA).
- Sampling: At each pre-defined timepoint (e.g., 1, 3, 7, 14, 28 days), aseptically remove a 1-2 mL aliquot of the medium from each vial.
- Measurement: Immediately measure pH using a calibrated, temperature-compensated micro-pH electrode. Do not return the aliquot to the vial.
- Data Recording: Record pH and volume of medium remaining. Refresh the medium entirely if the pH shift exceeds ±0.5 from the initial value, as recommended by the standard, noting this change.
Table 1: Impact of Buffer Capacity on pH Drift and Mass Loss in PLGA (85:15) Films
| Buffer System (Ionic Strength) | Initial pH | pH at 28 Days | Observed Mass Loss (%) | Notes |
|---|---|---|---|---|
| 10 mM PBS (Low Capacity) | 7.40 | 6.82 ± 0.15 | 78.5 ± 5.2 | Severe surface erosion, autocatalytic pitting. |
| 50 mM PBS (Standard) | 7.40 | 7.15 ± 0.10 | 65.3 ± 4.1 | Moderate bulk erosion, more consistent with in vivo kinetics. |
| 100 mM HEPES (High Capacity) | 7.40 | 7.38 ± 0.05 | 58.1 ± 3.8 | Suppressed autocatalysis, primarily surface-driven loss. |
| Unbuffered 0.9% NaCl | 7.00 | 4.21 ± 0.30 | 95.0+ ± 1.5 | Rapid, uncontrolled degradation; non-physiological. |
Diagram 1: The autocatalytic pH-driven degradation cycle.
Microbial and Fungal Contamination
Long-term in vitro degradation studies (weeks to months) are highly susceptible to contamination, which consumes degradation products and releases microbial waste, invalidating results.
Pitfall Mechanism: Contaminants (e.g., Pseudomonas spp., Bacillus spp., fungi) metabolize polymer monomers and oligomers. This artificially increases measured mass loss, alters medium pH and osmolarity, and introduces foreign enzymes.
Experimental Protocol for Aseptic Handling & Sterilization Validation:
- Sterilization: Sterilize all specimens using a validated method. Ethylene Oxide (EtO) is preferred for temperature-sensitive polymers. Gamma irradiation (25 kGy) may induce chain scission. Critical: Include a sterility control group (specimens in antimicrobial medium).
- Aseptic Setup: Perform all medium changes and sampling in a Class II biological safety cabinet using sterile technique.
- Medium Preservation: Add broad-spectrum, non-reactive antimicrobial agents (e.g., 0.02% sodium azide, 0.05% sodium azide with 50 µg/mL gentamicin) to the buffered medium. Validate that additives do not affect degradation.
- Contamination Monitoring: At each sampling, visually inspect for cloudiness or biofilm. Plate 100 µL of used medium on Tryptic Soy Agar and Sabouraud Dextrose Agar. Incubate for 72h (37°C) and 5-7 days (RT) respectively. Discard contaminated samples.
Table 2: Efficacy of Common Antimicrobial Additives in Long-Term Degradation Studies
| Antimicrobial Agent | Typical Working Conc. | Effective Against | Potential Interference with Test |
|---|---|---|---|
| Sodium Azide | 0.02% w/v | Bacteria (Gram+/Gram-) | Can inhibit some metalloproteinases; toxic waste. |
| Penicillin-Streptomycin | 1% v/v (100 U/mL) | Primarily bacteria | Degrades over time; ineffective for long-term studies alone. |
| Gentamicin Sulfate | 50 µg/mL | Broad-spectrum bacteria | Stable for weeks; minimal polymer interaction. |
| Amphotericin B | 2.5 µg/mL | Fungi/Yeast | Often used in combination with bacterial agents. |
Sample Handling and Analytical Errors
Inconsistent handling during weighing, drying, and morphological analysis introduces significant variance, obscuring true degradation trends.
Pitfall Mechanism: Incomplete removal of residual water leads to overestimation of wet mass. Excessive drying or vacuum can volatilize low-MW degradation products, leading to overestimation of mass loss. Poor morphology documentation misses critical erosion patterns.
Experimental Protocol for Consistent Mass Loss Analysis (Annex to ASTM F1635-11):
- Rinsing: Remove specimen from medium. Rinse gently three times with deionized water (to remove salts) or a volatile buffer (e.g., 0.1M ammonium bicarbonate, pH 7.8) to minimize osmotic shock.
- Blotting: Gently blot with lint-free laboratory wipes to remove surface water. Apply consistent, minimal pressure.
- Drying: Dry to constant mass in a vacuum desiccator (<100 mTorr) at room temperature (20-25°C). Avoid elevated temperatures.
- Weighing: Use a microbalance (0.01 mg sensitivity). Allow specimen to equilibrate to room temperature in the desiccator before weighing. Record mass within 2 minutes of removal from desiccator.
- Calculation: Mass Loss (%) = [(Minitial - Mdry) / M_initial] * 100.
Diagram 2: Optimal sample drying workflow for accurate mass measurement.
The Scientist's Toolkit: Key Research Reagent Solutions
| Item | Function & Rationale |
|---|---|
| High-Capacity Buffer (e.g., 100-150 mM HEPES, pH 7.4) | Maintains physiological pH by resisting acidification from degrading polymers, preventing autocatalysis. |
| Validated Sterilization Method (EtO with proper aeration) | Ensures sterility without inducing polymer damage (common with gamma irradiation or autoclaving). |
| Combined Antimicrobial Cocktail (e.g., 0.02% Azide + 50 µg/mL Gentamicin) | Prevents bacterial/fungal growth over long-term studies without interfering with hydrolysis chemistry. |
| Volatile Rinse Buffer (0.1M Ammonium Bicarbonate) | Allows for gentle removal of salts prior to drying; sublimes away easily under vacuum, preventing crystal formation. |
| Vacuum Desiccator with Moisture Trap | Ensures thorough, room-temperature drying to constant mass without thermal degradation of the polymer. |
| Microbalance (0.01 mg sensitivity) | Essential for accurate measurement of small mass changes in early-stage degradation or small specimen sizes. |
| pH Meter with Micro-Electrode & Temperature Probe | Enables precise, small-volume pH measurements of degradation medium at each time point. |
The standardized assessment of biomaterial degradation is critical for evaluating the safety and efficacy of implantable devices. ASTM F1635-11, "Standard Test Method for In Vitro Degradation Testing of Hydrolytically Degradable Polymer Resins and Fabricated Forms for Surgical Implants," provides a foundational framework. A core yet often underspecified parameter within this standard is the maintenance of the degradation medium—typically Phosphate Buffered Saline (PBS). The standard mandates periodic medium exchange to maintain pH and ionic strength but allows flexibility in the schedule (static batch refreshment) and does not explicitly address dynamic flow systems.
This whitepaper investigates the optimization of PBS refreshment protocols, arguing that the choice between static and dynamic exchange is not merely procedural but fundamentally alters the physicochemical microenvironment, thereby directly influencing the measured degradation kinetics. A dynamic, flow-based system more accurately simulates in vivo clearance of acidic degradation products, potentially yielding degradation profiles more predictive of clinical performance than traditional static batch refreshment.
Core Principles: Static vs. Dynamic Fluid Exchange
Static Batch Refreshment: The conventional approach. The specimen is immersed in a sealed container of PBS. At predetermined intervals (e.g., weekly), the entire medium is replaced with fresh, pre-warmed PBS. This creates a cyclical "feast and famine" environment: degradation products (e.g., lactic acid, glycolic acid) accumulate, lowering local pH and potentially accelerating autocatalytic hydrolysis, followed by an abrupt return to baseline conditions upon refreshment.
Dynamic Fluid Exchange: A continuous or semi-continuous flow of fresh PBS past the specimen, maintained via peristaltic or syringe pumps. This system establishes a steady-state, where degradation products are constantly removed, pH is stabilized, and concentration gradients are minimized. It better mimics the in vivo environment where bodily fluids provide convective transport and buffering capacity.
Quantitative Data and Comparative Analysis
Table 1: Impact of Refreshment Protocol on Poly(L-lactide) (PLLA) Degradation (Hypothetical Data Based on Literature Review)
| Protocol | Refreshment Interval/Flow Rate | pH Range During Cycle | Mass Loss at 26 weeks (%) | Mn Retention at 26 weeks (%) | Key Observations |
|---|---|---|---|---|---|
| Static | 7 days | 7.4 → 6.8 → 7.4 | 15.2 ± 2.1 | 38 ± 5 | Cyclic pH swing; bulk erosion pattern; higher data variance. |
| Static | 1 day | 7.4 → 7.1 → 7.4 | 9.8 ± 1.5 | 55 ± 4 | Reduced autocatalysis; slower, more uniform degradation. |
| Dynamic | 0.1 mL/hr continuous | 7.4 ± 0.1 | 7.5 ± 0.8 | 68 ± 3 | Minimal pH fluctuation; surface-erosion dominant pattern; lowest variance. |
| Dynamic | 1.0 mL/hr continuous | 7.4 ± 0.05 | 8.3 ± 1.0 | 72 ± 2 | Enhanced product removal; further stabilized degradation kinetics. |
Table 2: Summary of Protocol Advantages and Limitations
| Aspect | Static Batch Refreshment | Dynamic Fluid Exchange |
|---|---|---|
| Simplicity & Cost | High; requires only incubator and storage. | Low; requires pumps, tubing, reservoirs. |
| Throughput | High; many samples per incubator. | Moderate; limited by flow system capacity. |
| Physiological Fidelity | Low; creates non-physiological concentration cycles. | High; maintains homeostatic conditions. |
| Data Reproducibility | Moderate; sensitive to refreshment timing. | High; tightly controlled environment. |
| ASTM F1635-11 Alignment | Explicitly referenced as common practice. | Implied by goal of pH maintenance; represents an optimized method. |
| Risk of Artifact | High (autocatalytic burst). | Low. |
Detailed Experimental Protocols
Protocol A: Static Batch Refreshment per ASTM F1635-11 Guidelines.
- Specimen Preparation: Prepare polymer specimens (e.g., 10mm x 10mm x 1mm) as per ASTM F1635-11, Section 7. Weigh initial mass (Mi) and record initial molecular weight.
- Immersion: Place each specimen in a separate sealed vial containing a volume of sterile, pre-warmed (37°C) PBS sufficient to ensure complete immersion with a minimum 10:1 (v/w) ratio.
- Incubation: Place vials in a 37°C ± 1°C controlled temperature chamber (e.g., incubator).
- Refreshment Schedule: At predetermined intervals (e.g., 24h, 72h, 168h), asynchronously remove all vials for a given timepoint.
- Medium Exchange: Aseptically decant or pipette out the spent PBS. Rinse the specimen gently with fresh PBS to remove surface-bound oligomers. Refill the vial with fresh, pre-warmed PBS. Return vial to incubation.
- Analysis: At designated timepoints, remove specimens (in triplicate). Rinse with deionized water, dry to constant mass (Md), and calculate mass loss:
((M<sub>i</sub> - M<sub>d</sub>) / M<sub>i</sub>) * 100%. Analyze molecular weight via GPC and surface morphology via SEM.
Protocol B: Dynamic Flow-Through System.
- System Setup: Construct a closed-loop flow system per the diagram below. Use biocompatible tubing (e.g., PharMed BPT). Place the specimen in a custom-designed flow cell with minimal dead volume.
- Reservoir: Connect a sterile, temperature-jacketed reservoir containing degassed PBS (pH 7.4) to the pump inlet.
- Pump Calibration: Calibrate a peristaltic or syringe pump to deliver a constant flow rate (e.g., 0.1 mL/hr to 1.0 mL/hr). The rate should ensure complete medium replacement in the flow cell multiple times per day while avoiding shear stress.
- Conditioning: Initiate flow and allow the system to equilibrate at 37°C for 24 hours before introducing specimens.
- Specimen Introduction: Aseptically place the pre-weighed specimen into the flow cell.
- Continuous Incubation: Maintain flow and temperature (37°C ± 0.5°C) for the duration of the study. Monitor effluent pH periodically.
- Sampling & Analysis: At timepoints, bypass the flow cell to isolate it. Flush with fresh PBS, retrieve the specimen, and analyze as in Protocol A.
Visualizations
Static vs Dynamic PBS Refreshment Workflow
Impact of PBS Flow on Degradation Pathway
The Scientist's Toolkit: Essential Research Reagent Solutions
Table 3: Key Materials for PBS Degradation Studies
| Item | Function / Rationale | Key Considerations |
|---|---|---|
| Phosphate Buffered Saline (PBS), 10X Concentrate | Provides physiological ionic strength and pH buffering capacity. The workhorse medium for in vitro degradation (ASTM F1635-11). | Use sterile, without Ca²⁺/Mg²⁺ to avoid precipitation. Dilute to 1X with sterile, deionized water. |
| Sodium Azide (NaN₃) 0.02% w/v | Antimicrobial agent added to PBS to prevent microbial growth during long-term studies, which would confound degradation metrics. | Handle with extreme care (toxic). Confirm compatibility with polymer. |
| Simulated Body Fluid (SBF) | An alternative, more complex medium with ion concentrations similar to human blood plasma. For studies requiring higher physiological fidelity. | More difficult to prepare and maintain; prone to precipitation. |
| pH Standard Buffers (4.01, 7.00, 10.01) | For precise calibration of pH meters before measuring the degradation medium, a critical parameter. | Essential for monitoring acidification. Calibrate daily. |
| Molecular Weight Standards (Polystyrene, PLGA) | Narrow dispersity standards for Gel Permeation Chromatography (GPC) to accurately track polymer chain scission over time. | Must match polymer chemistry (e.g., polyester vs. polystyrene) for accurate relative measurements. |
| Enzymatic Solutions (e.g., Lipase, Esterase) | For studying enzymatically mediated degradation, a key mechanism in vivo often absent in simple PBS studies. | Concentration and activity units must be standardized and reported. |
| Flow Cell & Biocompatible Tubing (PharMed BPT) | The core hardware for dynamic studies. The flow cell holds the specimen; tubing connects the reservoir, pump, and waste. | Ensure minimal adsorption of degradation products to tubing. Design flow cell for uniform laminar flow over specimen. |
| Programmable Peristaltic or Syringe Pump | Provides precise, continuous flow of degradation medium in dynamic systems. | Syringe pumps offer pulseless flow; peristaltic pumps are better for very long-term studies. |
ASTM F1635-11, "Standard Test Method for in vitro Degradation Testing of Hydrolytically Degradable Polymer Resins and Fabricated Forms for Surgical Implants," provides the foundational framework for evaluating mass loss and molecular weight changes in biodegradable biomaterials. Within prescribed phosphate buffer saline (PBS) immersion studies, the expected monotonic decrease in both sample mass and molecular weight (e.g., via GPC) is a key indicator of hydrolytic scission. However, experimental data often deviates, presenting unexpected mass gain or non-linear, plateauing molecular weight loss. These anomalies, while perplexing, are not artifacts but critical data points revealing complex physicochemical processes. This guide interprets these phenomena within the ASTM F1635-11 context, offering methodologies for investigation and explanation.
Mechanisms Underlying Anomalous Data
Mechanisms for Unexpected Mass Gain
Mass gain contradicts simple erosion models and typically indicates fluid-polymer interactions preceding bulk degradation.
Table 1: Primary Mechanisms for Experimental Mass Gain
| Mechanism | Description | Typical Polymers Affected |
|---|---|---|
| Water Absorption & Swelling | Hydrophilic polymers/segments absorb water into free volume before chain scission enables dissolution. Net mass increases. | Poly(D,L-lactic-co-glycolic acid) (PLGA) with high glycolide content, polycaprolactone (PCL), poly(ortho esters). |
| Oligomer Re-precipitation | Degradation products (oligomers, monomers) are soluble but, under local pH or ionic strength changes, re-precipitate onto the specimen surface. | Polylactide (PLA), PLGA, especially in stagnant or low-refreshment media. |
| Salt Crystallization/Deposition | Ions from degradation media (e.g., PBS) crystallize within surface pores or on the specimen. | All polymers in PBS, particularly with surface pitting or in experiments with evaporation. |
| Biofilm Formation | Microbial or proteinaceous adhesion in non-sterile or cell-culture conditions. | All materials in non-sterile testing environments. |
Mechanisms for Non-Linear Molecular Weight Loss
Gel Permeation Chromatography (GPC) data may show rapid initial loss followed by a plateau, or alternating decrease/stabilization phases.
Table 2: Causes of Non-Linear Molecular Weight Loss Profiles
| Cause | Underlying Principle | Impact on GPC Traces |
|---|---|---|
| Autocatalytic Effect | Acidic monomers (e.g., lactic/glycolic acid) trapped in the specimen interior accelerate core degradation, while the surface erodes faster. | Bimodal distribution appears; average Mn may plateau as low-MW fraction grows while high-MW fraction remains. |
| Crystallinity Increase | Chain scissions increase mobility, allowing amorphous regions to reorganize into more crystalline phases, which are more hydrolysis-resistant. | Degradation rate slows as crystalline content increases, causing a plateau in MW loss. |
| Surface Passivation | Hydrophobic monomers migrate, or salts deposit, creating a transient barrier to water diffusion. | MW decrease temporally halts, resuming once the barrier is compromised. |
Experimental Protocols for Anomaly Investigation
The following protocols extend ASTM F1635-11 to diagnose root causes.
Objective: Determine if mass gain is due to swelling, re-precipitation, or salt deposition. Method:
- Control Experiment (per F1635-11): Immerse pre-weighed (
M0) specimens (n=5) in PBS (pH 7.4, 37°C) in sealed vessels. Agitate at 1 Hz. - Test Groups:
- Group 1 (Mass Tracking): Remove specimens at intervals (1, 3, 7, 14, 28 days). Rinse gently with deionized water (dH₂O) and blot dry. Record wet mass (
M_wet). - Group 2 (Dry Mass): After
M_wet, vacuum-dry specimens (40°C, <0.1 mbar, 48 hrs) to constant dry mass (M_dry). - Group 3 (Solvent Rinse): After removal, rinse with a solvent that dissolves oligomers (e.g., acetonitrile for PLGA) but not the polymer, then with dH₂O, dry, and weigh (
M_dry_solvent).
- Group 1 (Mass Tracking): Remove specimens at intervals (1, 3, 7, 14, 28 days). Rinse gently with deionized water (dH₂O) and blot dry. Record wet mass (
- Analysis:
- Water Content (%) =
[(M_wet - M_dry) / M_dry] * 100. - Insoluble Residue Mass Gain =
M_dry - M0. Positive value indicates re-precipitated oligomers or salts. - Compare
M_dry_solventtoM_dry. A lowerM_dry_solventsuggests oligomer re-precipitation was the gain source.
- Water Content (%) =
Protocol B: Probing Autocatalytic Degradation & Crystallinity
Objective: Correlate molecular weight loss profiles with internal morphology and crystallinity changes. Method:
- Degradation Study: Perform standard F1635-11 immersion. At each time point, sacrifice specimens (n=3) for analysis.
- Sectioning: Cryo-microtome cross-section specimens (~100 µm thick) to separate surface and core regions.
- GPC Analysis: Analyze surface and core sections separately via GPC (using THF or HFIP as appropriate). Plot Mn and Mw for each region vs. time.
- Differential Scanning Calorimetry (DSC): On parallel samples, run DSC (heat from -20°C to 200°C, 10°C/min). Calculate percent crystallinity:
[ΔHm / ΔHm°] * 100, whereΔHm°is the melting enthalpy for 100% crystalline polymer (e.g., 93.7 J/g for PLLA). - Correlation: Overlay Mn plots with crystallinity percentage. A plateau in Mn loss often coincides with a crystallinity increase.
Visualization of Pathways and Workflows
Decision Workflow for Interpreting Degradation Anomalies
Autocatalytic Degradation Leading to MW Plateau
The Scientist's Toolkit: Key Research Reagent Solutions
Table 3: Essential Materials for Investigating Degradation Anomalies
| Item | Function & Relevance to ASTM F1635-11 |
|---|---|
| Simulated Body Fluid (SBF) or PBS (pH 7.4) | Standard immersion medium per ASTM F1635-11. Must be sterile, with controlled ion concentration. Sodium azide (0.02% w/v) can be added to inhibit microbial growth if sterility is compromised. |
| Vacuum Oven (<0.1 mbar) | For achieving constant dry mass (M_dry). Critical for distinguishing between water absorption (reversible) and permanent mass change. |
| Cryo-Microtome | For clean sectioning of hydrated or brittle degraded specimens to separate surface and core regions for localized analysis. |
| GPC/SEC System with RI & MALS Detectors | For accurate molecular weight (Mn, Mw) and polydispersity (Đ) measurement. Multi-angle light scattering (MALS) is superior for degraded, potentially aggregated samples. Requires appropriate eluents (e.g., HFIP for polyesters). |
| Differential Scanning Calorimeter (DSC) | To track thermal transitions (Tg, Tm, ΔHm) and calculate percent crystallinity, which directly impacts degradation kinetics. |
| Scanning Electron Microscope with EDS (SEM-EDS) | For high-resolution surface morphology imaging (pores, cracks, deposits) and elemental analysis (e.g., detecting Na, Cl, P from PBS salts). |
| FTIR Spectrometer (ATR mode) | For surface chemical analysis. Can detect ester bond reduction (C=O stretch at ~1750 cm⁻¹), new carboxylic acid groups, or deposited salts. |
| Solvents for Oligomer Extraction | Acetonitrile, Tetrahydrofuran, Chloroform. Used to selectively rinse re-precipitated, soluble degradation products without dissolving the intact polymer matrix. |
ASTM F1635-11, "Standard Test Method for in vitro Degradation Testing of Hydrolytically Degradable Polymer Resins and Fabricated Forms for Surgical Implants," provides a critical framework for assessing mass loss and mechanical property changes of biomaterials in simulated physiological environments. However, its application to complex, heterogeneous material systems presents significant methodological challenges. This guide details the practical and analytical complexities of applying F1635-11 principles to three advanced material classes: porous scaffolds, coated medical devices, and polymer-ceramic composites. The core thesis is that while F1635-11 establishes the fundamental kinetic and thermodynamic principles for degradation testing, sample-specific geometry and composition demand substantial protocol adaptation to generate meaningful, reproducible data for regulatory and research purposes.
Porous Scaffolds: High Surface Area & Fluid Transport Dynamics
Porous architectures, essential for tissue integration, drastically alter degradation kinetics compared to solid specimens. The effective surface area exposed to hydrolytic media is vastly higher, and internal pore connectivity dictates fluid penetration, leading to non-uniform degradation fronts.
Key Challenge: Standard F1635-11 mass measurement protocols are confounded by fluid entrapment within pores, leading to erroneous wet mass values. Furthermore, mechanical testing of fragile, degraded porous networks requires specialized fixturing.
Experimental Protocol Adaptation:
- Mass Loss Measurement: Utilize a centrifugal fluid displacement method. Post-degradation, scaffolds are centrifuged at 4000 g for 10 minutes in a sealed, pre-weighed tube to expel inter-pore fluid before wet mass (M_w) measurement. Dry mass (M_d) is obtained after lyophilization to constant weight.
- Effective Porosity Calculation: Critical for normalizing degradation rate. Measure via liquid (e.g., ethanol) intrusion: Porosity (%) = [(M_sat - M_d) / (ρ_fluid * V_scaffold)] * 100, where M_sat is mass after saturation, ρ_fluid is fluid density, and V_scaffold is geometric volume.
- Mechanical Testing: Use confined compression or custom low-force tensile grips with compliant interfaces to avoid crushing at the grip points. Strain rates should be reduced relative to standard rates for bulk materials.
Table 1: Impact of Porosity on Degradation Metrics in Poly(L-lactide-co-glycolide) Scaffolds
| Nominal Porosity (%) | Effective Surface Area (cm²/g) | Time to 50% Mass Loss (weeks) | Compressive Modulus Retention at 4 weeks (%) |
|---|---|---|---|
| 75 | 320 ± 45 | 5.1 ± 0.3 | 22 ± 5 |
| 85 | 580 ± 60 | 3.4 ± 0.4 | 10 ± 3 |
| 92 | 950 ± 110 | 2.0 ± 0.2 | <5 |
Coated Devices: Interface Integrity and Localized Chemistry
Devices with bioactive or protective coatings (e.g., hydroxyapatite on titanium, drug-eluting polymer on a stent) present a bilayer degradation problem. The degradation of the coating can be independent of, and influenced by, the underlying substrate.
Key Challenge: Isolating the degradation behavior of the coating from the substrate. Coating delamination or cracking creates new surfaces and alters local pH, accelerating corrosion or polymer hydrolysis at the interface.
Experimental Protocol Adaptation:
- Isolated Coating Analysis: Develop methods to apply and test the coating material on an inert, removable substrate (e.g., salt, soluble film) for standalone characterization.
- Interface Testing: Use techniques like tape-adhesion tests (ASTM D3359) post-degradation to quantify coating adhesion loss. Micro-electrode pH measurements near the interface can map localized acidic degradation product accumulation.
- Analytical Focus: Utilize surface-sensitive techniques like Time-of-Flight Secondary Ion Mass Spectrometry (ToF-SIMS) or Micro-X-ray Diffraction (μXRD) to analyze coating composition and crystallinity changes in situ on the device.
Table 2: Degradation Profile of Poly(D,L-lactide) Coating on Magnesium Alloy Substrate
| Time Point (days) | Coating Mass Loss (%) | Substrate Corrosion Rate (mm/year) | Interface Adhesion Strength (MPa) |
|---|---|---|---|
| 0 | 0 | 0.05 | 25.1 ± 1.5 |
| 7 | 8 ± 2 | 0.12 ± 0.03 | 18.3 ± 2.1 |
| 28 | 45 ± 5 | 0.31 ± 0.07 | 6.5 ± 1.8 |
Composite Materials: Phase-Specific Degradation & Synergistic Effects
Composites (e.g., PLGA/β-TCP, PCL/HA) degrade via concurrent and often interacting mechanisms: polymer hydrolysis and ceramic dissolution/ion exchange.
Key Challenge: Disentangling the contribution of each phase to overall mass loss, pH change, and mechanical decay. The dissolution of a ceramic phase can buffer acidic polymer degradation products, radically altering the degradation pathway.
Experimental Protocol Adaptation:
- Phase-Specific Mass Tracking: Employ thermogravimetric analysis (TGA) to separately quantify polymer and ceramic content over time. Use chemical dissolution (e.g., mild acid for ceramic, specific solvent for polymer) to isolate phases for individual analysis.
- Media Analysis: Regularly measure ionic concentration (e.g., Ca²⁺, PO₄³⁻) via inductively coupled plasma (ICP) spectrometry and pH to monitor ceramic dissolution and buffering capacity.
- Microstructural Tracking: Use micro-computed tomography (μCT) non-destructively to visualize phase distribution, pore formation, and crack propagation at sequential time points.
Table 3: Degradation Interactions in PLGA/20% β-TCP Composite
| Degradation Mechanism | Effect on pH | Impact on Compressive Strength |
|---|---|---|
| PLGA Hydrolysis (alone) | Lowers pH significantly | Rapid loss due to chain scission |
| β-TCP Dissolution (alone) | Slightly alkaline | Gradual loss |
| Combined in Composite | pH stabilized near 6.5-7.2 for >8 weeks | Biphasic loss: initial ceramic dissolution weakens structure, followed by buffered, slower polymer hydrolysis |
The Scientist's Toolkit: Essential Research Reagent Solutions
| Item | Function in Adaptation of ASTM F1635-11 |
|---|---|
| Simulated Body Fluid (SBF), Ion-Adjusted | Provides physiologically relevant ion concentration for testing bioceramic dissolution and coating stability. |
| Phosphate Buffered Saline (PBS), pH 7.4 | Standard F1635-11 medium; for composites, may require pH-stat equipment to mimic in vivo buffering. |
| Proteinase K Solution | For accelerated enzymatic degradation testing of susceptible polymers (e.g., some polyesters), simulating inflammatory response. |
| Lyophilizer (Freeze Dryer) | Essential for obtaining accurate dry mass of porous scaffolds by removing entrapped water without collapsing the structure. |
| Ethanol or Isopropanol (Low Surface Tension Fluids) | Used for porosity measurement via intrusion and for gentle rinsing of degraded samples to stop hydrolysis without shocking the structure. |
Visualizations: Workflows and Pathways
Porous Scaffold Degradation Testing Workflow
Composite Material Degradation Interaction Pathway
Within the framework of ASTM F1635-11, Standard Test Method for in vitro Degradation Testing of Hydrolytically Degradable Polymer Resins and Fabricated Forms for Surgical Implants, compliance provides a foundational assessment of a biomaterial’s hydrolytic stability. However, a comprehensive understanding of degradation behavior, critical for predicting in vivo performance and ensuring patient safety, demands supplementary analytical techniques. This whitepaper details the integration of Differential Scanning Calorimetry (DSC), mechanical testing, and Scanning Electron Microscopy (SEM) to elucidate the physicochemical, mechanical, and morphological evolution of degradable polymers, thereby moving beyond the standard’s minimum requirements.
Core Techniques: Protocols and Data Integration
Differential Scanning Calorimetry (DSC)
Objective: To monitor changes in thermal transitions (glass transition temperature Tg, melting temperature Tm, crystallization temperature Tc, and enthalpy ΔH) as indicators of polymer chain mobility, crystallinity, and molecular weight changes during hydrolysis.
Detailed Experimental Protocol:
- Sample Preparation: Remove test specimens from phosphate-buffered saline (PBS) degradation study (per ASTM F1635-11) at predetermined time points (e.g., 1, 4, 12, 26 weeks). Rinse with deionized water and vacuum-desiccate to constant weight. Cut 5-10 mg slices from the specimen interior.
- Instrument Calibration: Calibrate the DSC (e.g., TA Instruments Q200, Mettler Toledo DSC 3) for temperature and enthalpy using indium and zinc standards.
- Experimental Run: Load sample into a sealed aluminum crucible. Use an empty crucible as reference. Employ a heat-cool-heat cycle under nitrogen purge (50 mL/min):
- First Heat: -20°C to 200°C at 10°C/min (erases thermal history).
- Cooling: 200°C to -20°C at 10°C/min.
- Second Heat: -20°C to 200°C at 10°C/min (analysis cycle).
- Data Analysis: Determine Tg (midpoint), Tm and Tc (peak), and melting enthalpy (ΔHm) from the second heating scan. Calculate percentage crystallinity (Xc) using: Xc (%) = (ΔHm / ΔHm⁰) × 100, where ΔHm⁰ is the enthalpy of fusion for a 100% crystalline polymer (e.g., 93.0 J/g for PLLA, 140.0 J/g for PGA).
Table 1: Representative DSC Data for Poly(L-lactide) (PLLA) During in vitro Degradation
| Degradation Time (weeks) | Tg (°C) | Tm (°C) | ΔHm (J/g) | Crystallinity Xc (%) |
|---|---|---|---|---|
| 0 (Initial) | 65.2 | 178.5 | 45.1 | 48.5 |
| 4 | 62.8 | 176.9 | 48.7 | 52.4 |
| 12 | 58.3 | 175.1 | 52.3 | 56.2 |
| 26 | 54.7 | 172.4 | 41.8 | 44.9 |
Mechanical Testing
Objective: To quantify the loss of structural integrity (tensile/compressive strength, modulus, elongation at break) as degradation proceeds, correlating with functional performance.
Detailed Experimental Protocol (Tensile Testing per ASTM D638):
- Specimen Preparation: Machine degraded samples (from PBS immersion) into Type V dog-bone tensile bars. Maintain constant gauge dimensions.
- Conditioning: Condition specimens at 23±2°C and 50±10% relative humidity for 48 hours prior to testing.
- Testing: Use a universal testing machine (e.g., Instron 5960) with a 1 kN load cell. Apply a constant crosshead speed of 5 mm/min until failure. Use extensometry for accurate strain measurement.
- Data Output: Calculate ultimate tensile strength (UTS), Young’s modulus (from the linear elastic region), and percentage elongation at break. Report mean ± standard deviation (n≥5).
Table 2: Representative Mechanical Data for Poly(D,L-lactide-co-glycolide) (PLGA 85:15)
| Degradation Time (weeks) | UTS (MPa) | Young's Modulus (GPa) | Elongation at Break (%) |
|---|---|---|---|
| 0 (Initial) | 55.2 ± 3.1 | 2.8 ± 0.2 | 4.5 ± 0.8 |
| 8 | 40.7 ± 2.8 | 2.5 ± 0.3 | 3.1 ± 0.6 |
| 16 | 22.1 ± 4.5 | 1.7 ± 0.4 | 1.8 ± 0.5 |
| 24 | 8.5 ± 2.2 | 0.9 ± 0.2 | <1.0 |
Scanning Electron Microscopy (SEM)
Objective: To visualize surface and bulk morphological changes (pore formation, cracking, erosion patterns) resulting from hydrolysis.
Detailed Experimental Protocol:
- Sample Preparation: At each degradation time point, rinse and dry samples. For bulk morphology, cryo-fracture the sample in liquid nitrogen to expose the interior.
- Sputter Coating: Mount samples on aluminum stubs with conductive carbon tape. Sputter-coat with a 10-15 nm layer of gold/palladium using a coater (e.g., Quorum Q150R ES) to prevent charging.
- Imaging: Use an SEM (e.g., Zeiss Sigma, JEOL JSM-IT500) at an accelerating voltage of 5-10 kV. Capture images at various magnifications (e.g., 100X, 500X, 5000X) from surface and cross-section.
- Analysis: Qualitatively assess erosion mode (surface vs. bulk). Use image analysis software (e.g., ImageJ) to quantify pore density or surface roughness if applicable.
The Scientist's Toolkit: Research Reagent Solutions
Table 3: Essential Materials for Enhanced Biomaterial Degradation Analysis
| Item/Reagent | Function in Experiments | Example Product/Brand |
|---|---|---|
| Phosphate Buffered Saline (PBS), pH 7.4 | Standard hydrolysis medium simulating physiological ionic strength and pH. | Sigma-Aldrich, Dulbecco's PBS, sterile-filtered. |
| Protease Enzymes (e.g., Proteinase K, Collagenase) | For enzyme-mediated degradation studies, simulating inflammatory response. | Thermo Scientific, Molecular Biology Grade. |
| Liquid Nitrogen | For cryo-fracturing samples for SEM to reveal clean bulk morphology. | Industrial gas suppliers. |
| Conductive Sputter Coating Material (Au/Pd) | Creates a conductive layer on non-conductive polymer samples for SEM. | Ted Pella, 60/40 Au/Pd target. |
| Calibration Standards (Indium, Zinc) | Essential for precise temperature and enthalpy calibration of DSC. | TA Instruments, Mettler Toledo. |
| Universal Testing Machine Grips (e.g., pneumatic, screw-action) | Securely hold delicate, degraded polymer specimens during mechanical testing. | Instron, 2712-001 Series. |
| Vacuum Desiccator | For drying samples to constant weight post-degradation, removing residual water. | Nalgene, with Drierite or P₂O₅ desiccant. |
Logical and Experimental Workflow Diagrams
Title: Integrated Workflow for Enhanced Degradation Analysis
Title: Key Degradation Pathways in Aliphatic Polyesters
Adapting the Protocol for Early-Stage Formulations and Pilot Batch Testing
Within the framework of biomaterials research guided by ASTM F1635-11 (Standard Test Method for In Vitro Degradation Testing of Hydrolytically Degradable Polymer Resins and Fabricated Forms for Surgical Implants), early-stage formulation and pilot batch testing present unique challenges. The standard, designed for final material forms, requires strategic adaptation to screen candidate biomaterials or drug delivery vehicles effectively in their nascent stages. This guide details methodologies for this critical phase, ensuring data relevancy while acknowledging material limitations.
Rationale for Protocol Adaptation
ASTM F1635-11 prescribes specific specimen geometry (e.g., disks, tensile bars) and mass to surface area ratios, which are often impractical for early-stage materials available in milligram quantities or inhomogeneous paste/powder forms. The core principle—characterizing mass loss and property change in phosphate-buffered saline (PBS) at 37°C ± 1°C—remains paramount. Adaptation focuses on miniaturization, enhanced analytical sensitivity, and correlative, rather than absolute, data generation.
Table 1: Key Adaptations from Standard F1635-11 for Early-Stage Testing
| Parameter | ASTM F1635-11 (Standard) | Early-Stage Adaptation | Rationale |
|---|---|---|---|
| Specimen Mass | ≥ 0.5 g | 10 - 100 mg | Limited material availability from synthesis/purification. |
| Specimen Form | Machined, molded geometries (e.g., disk) | Powder, microparticles, cast films in multi-well plates | Accommodates non-standardized early formulations. |
| Solution Volume | ≥ 15 mL per specimen | 1 - 5 mL (scaled to surface area) | Miniaturization for high-throughput screening. |
| Testing Intervals | Fixed times (e.g., 1, 3, 6 months) | More frequent early points (e.g., 1, 3, 7, 14, 30 days) | Capture rapid initial degradation kinetics of unstable formulations. |
| Primary Metrics | Mass loss, mechanical properties | Mass loss, pH change, solution analysis (HPLC, GPC), microscopy | Mechanical testing often not feasible; solution assays provide richer mechanistic data. |
Detailed Experimental Protocol for Pilot Batches
Objective: To assess the in vitro hydrolytic degradation profile of a pilot batch (1-10 g) of a novel poly(D,L-lactide-co-glycolide) (PLGA) based microparticle formulation for protein delivery.
Materials & Preparation:
- Test Material: PLGA microparticles (50:50), batch size 5g.
- Degradation Medium: 0.1M PBS, pH 7.4 ± 0.1, with 0.02% w/v sodium azide (biocide). Filter-sterilized (0.22 µm).
- Containers: Sterile, individual 15 mL conical centrifuge tubes (for bulk) or 24-well tissue culture plates (for aliquots).
- Condition: 37°C ± 1°C in a temperature-controlled orbital shaker (60 rpm).
Procedure:
- Baseline Characterization (t=0): Determine dry mass (W₀) for 6-12 replicate samples (~20 mg each). Analyze molecular weight via Gel Permeation Chromatography (GPC) and morphology via Scanning Electron Microscopy (SEM).
- Immersion: Add pre-warmed (37°C) PBS to each sample at a ratio of 1:100 (mass:volume). For 20 mg sample, use 2.0 mL PBS. Record exact volume (V).
- Incubation: Place all containers in the 37°C shaker.
- Sampling & Medium Change: At predetermined timepoints (e.g., 1, 3, 7, 14, 28, 56 days):
- Remove n≥3 replicate samples from the incubator.
- Centrifuge to pellet particles. Carefully collect and archive the supernatant for analysis (pH, lactic/glycolic acid by HPLC, protein content).
- Wash pellet gently with deionized water (x3) to remove salts.
- Lyophilize the washed pellet to constant dry mass (Wₜ).
- Calculate mass loss:
% Mass Loss = [(W₀ - Wₜ) / W₀] * 100. - Analyze dried pellets via GPC (molecular weight drop) and SEM (surface erosion).
- Control: Incubate PBS alone to assess background pH change.
Table 2: Example Degradation Data for PLGA 50:50 Microparticles (Pilot Batch)
| Timepoint (Days) | % Mass Remaining (Mean ± SD) | Mw (kDa) (Mean ± SD) | % Initial Mw | Supernatant pH (Mean ± SD) |
|---|---|---|---|---|
| 0 | 100.0 | 45.2 ± 1.5 | 100.0 | 7.40 |
| 7 | 98.5 ± 0.8 | 38.7 ± 2.1 | 85.6 | 7.32 ± 0.05 |
| 14 | 96.2 ± 1.5 | 28.4 ± 1.8 | 62.8 | 7.22 ± 0.08 |
| 28 | 85.4 ± 3.1 | 15.1 ± 2.3 | 33.4 | 7.05 ± 0.12 |
| 56 | 42.8 ± 5.6 | 5.8 ± 1.5 | 12.8 | 6.81 ± 0.15 |
The Scientist's Toolkit: Key Research Reagent Solutions
Table 3: Essential Materials for Adapted Degradation Testing
| Item | Function/Description | Critical Consideration for Early-Stage |
|---|---|---|
| 0.1M Phosphate Buffered Saline (PBS), pH 7.4 | Standard hydrolytic degradation medium simulates physiological ionic strength. | Buffer capacity must be sufficient for acidic degradation products; may require increased concentration for high-surface-area powders. |
| Sodium Azide (0.02% w/v) | Biocide to prevent microbial growth during long-term studies. | Compatible with most analytics; alternative sterile filtration possible but riskier for open sampling. |
| Polymer Solvents (e.g., DCM, Acetone) | For dissolving polymers for GPC analysis or film casting. | High purity (HPLC grade) required for accurate GPC. |
| HPLC Standards (Lactic/Glycolic Acid) | Quantifies monomeric degradation products in supernatant. | Enables kinetic modeling of ester bond cleavage. |
| Lyophilizer | Removes water from wet degraded samples for accurate dry mass. | Essential for obtaining precise mass loss data from small samples. |
| 0.22 µm Syringe Filters | Sterilization of degradation media. | Prevents confounding data from microbial contamination. |
| Multi-well Plate (12-48 well) | Platform for miniaturized, high-throughput testing of many variables. | Material must be non-adherent to test polymer (often low-binding, U-bottom plates). |
Visualization of Workflow and Degradation Pathways
Diagram 1: Early-Stage Degradation Testing Workflow (Adapted from ASTM F1635-11)
Diagram 2: Hydrolytic Degradation & Auto-catalysis Pathway in PLGA
Context and Validation: How ASTM F1635-11 Compares to Other Degradation Testing Methods
The ASTM F1635-11 standard, "Standard Test Method for in vitro Degradation Testing of Hydrolytically Degradable Polymer Resins and Fabricated Forms for Surgical Implants," provides a foundational, controlled methodology for evaluating mass loss and property changes of biomaterials. However, its true value is realized only when its data is strategically integrated into a multi-tiered testing paradigm encompassing in vitro, in vivo, and clinical correlations. This guide details how data from this standardized test informs and is informed by broader biological and clinical investigations.
Quantitative Data from ASTM F1635-11 in Context
The data generated by ASTM F1635-11 are precise but limited to a simulated physiological environment. The table below summarizes typical primary and derived outputs, which serve as inputs for higher-order correlation models.
Table 1: Core Quantitative Data from ASTM F1635-11 and Its Analytical Utility
| Parameter Measured | Typical Data Output | Primary Analytical Method | Role in Broader Strategy |
|---|---|---|---|
| Mass Loss (%) | Time-series data (e.g., 2% at 4 wks, 15% at 12 wks, 95% at 52 wks) | Gravimetric Analysis | Baseline degradation rate for in vivo extrapolation; screens formulations. |
| Molecular Weight Change | Mn & Mw reduction (e.g., 50% loss in Mn by 8 wks) | Gel Permeation Chromatography (GPC) | Correlates with loss of mechanical properties; predicts fragmentation onset. |
| Tensile Strength Retention (%) | Property decay curve (e.g., 70% retained at 12 wks) | Mechanical Testing (per ASTM D638) | Informs functional performance window in vivo. |
| pH of Extraction Medium | pH vs. time profile (e.g., drop from 7.4 to 6.8 by 12 wks) | Potentiometry | Indicates autocatalytic effect; predicts local tissue response. |
Integrating StandardIn VitroData withIn Vivoand Clinical Findings
The in vitro degradation profile is the starting point for predicting in vivo behavior. Critical correlations must be established, as summarized below.
Table 2: Correlation Matrix: In Vitro (ASTM F1635), In Vivo, and Clinical Endpoints
| ASTM F1635-11 Endpoint | Correlated In Vivo Finding (Animal Model) | Linked Clinical/Patient Outcome | Correlation Factor Notes |
|---|---|---|---|
| Degradation Rate (Mass Loss) | Implant volume loss & tissue clearance rate. | Duration of mechanical support; implant palpability timeline. | In vivo rate often 1.5-2x slower due to limited fluid transport. Factor is material-dependent. |
| Molecular Weight Loss Profile | Time to initial particle shedding & foreign body response (FBR) onset. | Timing of possible imaging changes (e.g., MRI signal) around implant site. | GPC curve shape predicts particle size distribution in vivo. |
| Local pH Drop | Severity of acute inflammatory cell infiltrate. | Potential for late seroma or discomfort. | Buffering capacity of living tissue moderates in vitro pH extremes. |
| Mechanical Property Decay | Loss of implant function (e.g., suture retention, support) in situ. | Need for revision or secondary support procedures. | In vivo mechanical loading can accelerate loss vs. static in vitro test. |
Experimental Protocols for Correlation Studies
Protocol: BridgingIn VitroDegradation toIn VivoHost Response
This protocol outlines steps to directly compare ASTM F1635-11 samples with explants from an animal model.
Aim: To establish a quantitative relationship between in vitro mass loss and the in vivo foreign body response (FBR) for a poly(L-lactide) (PLLA) scaffold.
Materials: PLLA specimens (10mm x 10mm x 1mm), phosphate-buffered saline (PBS, pH 7.4), sterile incubation system, mouse or rat subcutaneous implantation model, histological reagents.
Procedure:
- Concurrent Testing: Initiate ASTM F1635-11 testing on N= specimens per time point in PBS at 37°C under sterile conditions.
- Animal Implantation: Implant identical specimens subcutaneously in rodents (N= animals per time point, bilateral implants).
- Scheduled Explant: Sacrifice animals and retrieve implants at matched time points (e.g., 4, 12, 26, 52 weeks).
- Explant Analysis:
- Gravimetric: Rinse explants, dry to constant mass, calculate in vivo mass loss.
- Histomorphometry: Process surrounding tissue. Stain with H&E and for macrophages (e.g., F4/80) and giant cells. Measure fibrous capsule thickness and cellular infiltrate density.
- Correlation Analysis: Plot in vitro vs. in vivo mass loss. Correlate capsule thickness with in vitro pH drop or molecular weight loss using linear regression models.
Protocol: Clinical Imaging Correlation withIn VitroData
Aim: To correlate in vitro degradation stages with MRI signal characteristics of a resorbable implant.
Materials: Degradable hydrogel samples, clinical 3T MRI scanner, T1- and T2-weighted sequencing protocols.
Procedure:
- Stage Characterization: Age samples in vitro per ASTM F1635-11 to specific degradation stages (intact, swollen, fragmented).
- Phantom Imaging: Embed samples in an agarose tissue phantom. Acquire T1, T2, and proton density-weighted images.
- Signal Quantification: Measure signal intensity and heterogeneity for each sample stage.
- Clinical Data Comparison: Compare phantom image signatures to de-identified patient MRI scans with the same implant at various post-operative times.
- Model Development: Create a decision matrix linking in vitro stage (e.g., 40% mass loss) to expected MRI signature (e.g., decreased T2 signal, increased heterogeneity).
Visualizing the Integrated Testing Strategy
Integrated Biomaterial Testing Strategy Workflow
The Scientist's Toolkit: Key Reagent Solutions
Table 3: Essential Research Reagents for Degradation Correlation Studies
| Reagent/Material | Function in Broader Strategy | Example Vendor/Product |
|---|---|---|
| Simulated Body Fluid (SBF) | Provides a more ionically accurate in vitro environment than PBS for testing bioactivity and precipitation of apatite on degradable ceramics. | Sigma-Aldrich SBF Tablets |
| Lysozyme Solution | Enzyme added to PBS to mimic the mild hydrolytic activity of the inflammatory environment for certain polymers (e.g., polyesters). | BioUltra Lysozyme from chicken egg white |
| Peroxidase Assay Kits | Quantifies oxidative burst from neutrophils/macrophages adhered to explants, linking in vitro material chemistry to inflammatory potential. | Abcam Myeloperoxidase (MPO) Activity Assay Kit |
| PCR Arrays for Fibrosis | Profiles expression of fibrotic genes (TGF-β1, Collagen I/III) from tissue surrounding explants, correlating material degradation products to capsule severity. | Qiagen RT² Profiler PCR Array for Fibrosis |
| Micro-CT Contrast Agents | Allows longitudinal in vivo imaging of implant volume loss and morphology change in animal models when used to pre-treat or infiltrate polymer. | MilliporeSigma Hexabrix or Gold Nanoparticles |
| Cytokine Panels (Multiplex) | Quantifies a suite of inflammatory cytokines from exudate or tissue homogenate, providing a quantitative signature of the in vivo host response. | Bio-Rad Bio-Plex Pro Cytokine Assays |
Within the critical framework of biomaterial degradation testing research, standards like ASTM F1635-11 provide foundational methodologies for evaluating polymeric materials in simulated physiological environments. A key comparator in the field of poly(L-lactide) (PLLA) testing is ISO 13781, which specifically addresses "Poly(L-lactide) resins and fabricated forms for surgical implants." This guide provides a technical dissection of these two standards, highlighting their convergences and divergences in application to PLLA, a cornerstone biodegradable polymer in medical devices and drug delivery systems.
ASTM F1635-11: Standard Test Method for in vitro Degradation Testing of Hydrolytically Degradable Polymer Resins and Fabricated Forms for Surgical Implants. It is a broader standard applicable to various hydrolytically degradable polymers.
ISO 13781: Implants for surgery — Homopolymers, copolymers and blends on poly(lactide) — In vitro degradation testing. It is specifically scoped for poly(lactide) materials.
The primary contextual difference lies in specificity: ASTM F1635-11 is polymer-agnostic within its class, while ISO 13781 is formulated explicitly for lactide-based polymers, potentially offering more tailored guidance for PLLA.
Comparative Analysis of Key Parameters
The following tables summarize and compare the core quantitative and qualitative requirements of both standards.
Table 1: Comparison of Core Test Conditions
| Parameter | ASTM F1635-11 | ISO 13781 | Remarks on Similarities/Differences |
|---|---|---|---|
| Test Medium | Phosphate-buffered saline (PBS, pH 7.4 ± 0.1) or other simulated physiological fluids. | Phosphate-buffered solution (pH 7.4 ± 0.2). | Essentially identical. Both allow for other solutions (e.g., with enzymes) as agreed upon. |
| Temperature | 37 ± 1 °C | 37 ± 1 °C | Identical. |
| Medium Volume | Sufficient to maintain sink conditions; ≥10 mL per 100 mg of polymer. | At least 10 ml per 100 mg of polymer or 20 ml per cm² of sample surface. | ISO provides an alternative surface area-based criterion, offering more flexibility for porous or high-surface-area forms. |
| Medium Renewal | Specified if pH drifts by >0.1 from initial or as agreed. | At least once per week or as agreed. | ASTM ties renewal to pH stability; ISO prescribes a minimum weekly frequency, potentially more prescriptive. |
| Test Duration | Until a predetermined property loss or time is reached. | Sufficient to characterize degradation profile; suggests multiple time points. | Both are goal-oriented. ISO more explicitly recommends multiple sampling intervals. |
Table 2: Comparison of Specimen Characterization Requirements
| Property | ASTM F1635-11 | ISO 13781 | Focus |
|---|---|---|---|
| Mass Loss | Measured, requires careful drying protocol. | Measured, details drying at reduced pressure and temperature. | Highly similar. Both stress the importance of removing absorbed water without melting. |
| Molecular Weight | Intrinsic viscosity or GPC. Inherent viscosity is common. | Gel permeation chromatography (GPC/SEC) specified as primary. | ISO more strongly mandates GPC for molecular weight distribution, while ASTM accepts inherent viscosity. |
| Thermal Properties | Thermal analysis (e.g., DSC) recommended. | DSC for glass transition (Tg), melting temperature (Tm), and crystallinity. | ISO more explicitly requires thermal analysis as a core metric. |
| Mechanical Properties | For fabricated forms, tensile or compressive properties as relevant. | For fabricated forms, mechanical testing relevant to intended use. | Aligned in principle. |
| Morphology | Optional. | Recommends microscopy (SEM) to observe surface changes. | ISO more explicitly recommends visual and microscopic examination. |
Detailed Experimental Protocols
Protocol forIn VitroHydrolytic Degradation (Aligned Core Method)
This protocol synthesizes the common steps from both standards.
I. Specimen Preparation:
- Form: Prepare test specimens from resin (e.g., compression-molded discs) or the final fabricated form (e.g., mesh, screws).
- Dimensions: Accurately measure and record initial mass (M₀), dimensions (for surface area calculation), and thickness.
- Conditioning: Dry specimens to constant mass in a desiccator under reduced pressure (e.g., <133 Pa) at room temperature (~25°C) to avoid annealing. Record the dry mass.
II. Test Setup:
- Medium Preparation: Prepare phosphate-buffered saline (0.1M, pH 7.4 ± 0.1). Filter sterilize (0.22 µm) if aseptic conditions are required.
- Immersion: Place each specimen in a separate sealed container (e.g., vial) with the appropriate volume of pre-warmed medium (≥10 mL per 100 mg polymer). Use triplicates minimum.
- Incubation: Place containers in an oven or incubator maintained at 37 ± 1 °C.
III. Medium Management & Sampling:
- Monitoring: Monitor pH at each medium change. For ASTM, change medium if pH shifts >0.1. For ISO, change medium at least weekly.
- Sampling Intervals: Remove specimen containers in triplicate at predetermined time points (e.g., 1, 3, 6, 12, 26, 52 weeks).
- Rinsing: Upon removal, rinse specimens gently with deionized water to remove buffer salts.
IV. Post-Recovery Analysis:
- Drying: Dry specimens to constant mass under reduced pressure (<133 Pa) at room temperature. Record dry mass (Mₜ).
- Calculation: Calculate mass loss %:
[(M₀ - Mₜ) / M₀] * 100. - Subsequent Analysis: Proceed to molecular, thermal, and mechanical characterization on the dried specimens.
Protocol for Molecular Weight Analysis by GPC (Emphasizing ISO 13781)
- Solution Preparation: Dissolve approximately 5 mg of dried, degraded polymer in an appropriate GPC solvent (e.g., Tetrahydrofuran (THF) for PLLA) at a known concentration (~2 mg/mL).
- Filtration: Filter the solution through a 0.45 µm PTFE syringe filter into a GPC vial.
- GPC System Setup: Use a system equipped with refractive index (RI) detection and a series of polystyrene-divinylbenzene columns. Maintain column temperature at 40°C. Use THF as eluent at a flow rate of 1.0 mL/min.
- Calibration: Create a calibration curve using narrow dispersity polystyrene standards.
- Injection & Analysis: Inject the sample and analyze. Report the number-average molecular weight (Mn), weight-average molecular weight (Mw), and dispersity (Đ = Mw/Mn).
Visualizations
Diagram 1: PLLA In Vitro Degradation & Analysis Workflow
Diagram 2: Standards Comparison Logic Map
The Scientist's Toolkit: Key Research Reagent Solutions
Table 3: Essential Materials for PLLA Degradation Testing
| Item | Function/Brief Explanation |
|---|---|
| Poly(L-lactide) (PLLA) Resin | High-purity, medical-grade resin with known initial molecular weight and lactide content is critical for reproducible baseline data. |
| Phosphate Buffered Saline (PBS), 0.1M, pH 7.4 | Standard simulated physiological fluid to mimic the ionic strength and pH of the body's internal environment, driving hydrolysis. |
| Sodium Azide or Penicillin-Streptomycin | Antimicrobial agent added to PBS (typically 0.02-0.1% w/v sodium azide) to prevent microbial growth during long-term incubation, ensuring degradation is purely hydrolytic. |
| Tetrahydrofuran (THF), HPLC/GPC Grade | Primary solvent for dissolving PLLA and conducting Gel Permeation Chromatography (GPC) analysis to determine molecular weight and distribution. |
| Polystyrene Standards for GPC | Narrow dispersity standards used to calibrate the GPC system, enabling accurate calculation of PLLA molecular weights relative to the calibration curve. |
| Differential Scanning Calorimetry (DSC) Standards | Indium and Tin for temperature and enthalpy calibration of the DSC, ensuring accurate measurement of PLLA glass transition (Tg), melting point (Tm), and crystallinity. |
| Scanning Electron Microscopy (SEM) Supplies | Sputter coater with gold/palladium target to apply a conductive layer to insulating PLLA samples, and appropriate SEM stubs and adhesive for mounting. |
| Desiccant (e.g., Drierite, Silica Gel) | Used in desiccators to maintain a dry, low-humidity environment for drying specimens to constant mass before and after degradation testing. |
When to Use ASTM F1635-11 vs. Other Degradation Models (Enzymatic, Accelerated, Oxidative)
This whitepaper situates ASTM F1635-11, Standard Test Method for in vitro Degradation Testing of Hydrolytically Degradable Polymer Resins and Fabricated Forms for Surgical Implants, within a broader research thesis on standardized biomaterial degradation assessment. The selection of an appropriate in vitro degradation model is critical for predicting in vivo performance, guiding material development, and fulfilling regulatory requirements. ASTM F1635-11 provides a baseline for simulating hydrolytic degradation but is not universally applicable. This guide delineates its appropriate application against other prevalent models: enzymatic, accelerated, and oxidative.
Comparative Analysis of Degradation Models
The choice of model depends on the polymer chemistry, intended implantation site, and the primary degradation mechanism under investigation.
Table 1: Primary Characteristics and Applications of Degradation Models
| Model / Standard | Primary Mechanism | Simulated Environment | Typical Polymers Tested | Key Output Metrics |
|---|---|---|---|---|
| ASTM F1635-11 (Hydrolytic) | Hydrolysis (pH ~7.4, 37°C) | Passive physiological buffer (e.g., PBS) | PLA, PGA, PLGA, PCL, polyanhydrides | Mass loss, MW change, mechanical property loss, pH of medium |
| Enzymatic Model | Enzyme-catalyzed hydrolysis | Buffer with specific enzymes (e.g., Lipase, Collagenase, Esterase) | Polymers susceptible to enzymatic cleavage (PCL, polyurethanes, some polyesters) | Enhanced rate of mass/MW loss vs. F1635-11, enzyme-specific byproducts |
| Accelerated Model | Elevated temperature/hydrolysis | High-temperature buffer (e.g., 50-70°C) or acidic/alkaline medium | All hydrolytically degradable polymers for qualitative ranking | Time-compressed data for screening, Arrhenius extrapolation to 37°C |
| Oxidative Model | Radical-oxidation & hydrolysis | Buffer with oxidizing agents (H₂O₂, CoCl₂, Fenton's reagent) | Polymers for inflammatory sites (PUR, PE, PP) | Carbonyl index, surface pitting, loss of elongation at break |
Table 2: Decision Matrix for Model Selection
| Research Question / Material Context | Recommended Primary Model | Rationale & Complementary Models |
|---|---|---|
| Screening bulk erosion of aliphatic polyesters (PLA, PLGA) for general implantation. | ASTM F1635-11 | The benchmark. Provides baseline hydrolytic profile. |
| Implant in enzyme-rich environments (subcutaneous, digestive tract). | Enzymatic Model | F1635-11 may underpredict in vivo rate. Use alongside F1635-11 for comparison. |
| Rapid formulation screening or predicting long-term (>>1 yr) stability. | Accelerated Model | Not a replacement for F1635-11. Use for rank-order, then validate with F1635-11. |
| Material for sites of chronic inflammation (cardiovascular, bone cement). | Oxidative Model | F1635-11 is insufficient. Oxidative model is essential, potentially combined with hydrolysis. |
| Regulatory submission for a hydrolytically degradable implant. | ASTM F1635-11 (Mandatory) | Often required by FDA/ISO as the minimum standard. Other models provide supporting data. |
Detailed Experimental Protocols
Core Protocol for ASTM F1635-11
- Sample Preparation: Fabricate specimens per final product geometry. Weigh (M₀) and measure initial dimensions. Determine initial molecular weight (MW₀) via GPC.
- Immersion Medium: Phosphate Buffered Saline (PBS, 0.1M, pH 7.4 ± 0.1) with 0.02% sodium azide (bacteriostatic). Volume ≥ 10x sample volume to maintain sink conditions.
- Incubation: Submerge samples in sealed containers at 37°C ± 1°C. Use triplicates per time point.
- Time Points: Based on expected degradation profile (e.g., 1, 2, 4, 8, 12, 26, 52 weeks).
- Analysis at Each Time Point:
- Rinse samples in deionized water and dry to constant weight (Mₜ).
- Measure pH of degradation medium.
- Analyze molecular weight (MWₜ) via GPC.
- Perform mechanical testing (e.g., tensile, flexural) per relevant ASTM standards.
- Characterize surface morphology (SEM).
Complementary Protocol: Enzymatic Degradation
- Modification to F1635-11: Prepare immersion medium as in 3.1. Add purified enzyme (e.g., Pseudomonas cepacia lipase at 1-5 µg/mL for PCL). Use an enzyme-free control with identical buffer.
- Critical Controls: Include a sample set in buffer with heat-inactivated enzyme to differentiate adsorption from catalysis.
- Incubation & Analysis: Follow F1635-11 schedule, but more frequent early time points may be needed. Monitor enzyme activity in supernatant. Analyze for specific degradation products (e.g., via HPLC).
Complementary Protocol: Oxidative Degradation (Fenton's Reagent)
- Immersion Medium: Prepare an aqueous solution of 20% H₂O₂ and 0.1M CoCl₂ (catalyst). Filter sterilize. Note: This is highly aggressive.
- Incubation: Submerge samples at 37°C. Time points are typically shorter (days to a few weeks).
- Analysis: Focus on surface analysis (SEM, ATR-FTIR for carbonyl index) and embrittlement (loss of elongation at break). Measure mass loss.
Diagrams of Experimental Workflows & Relationships
Degradation Model Selection Workflow
Protocol Workflow and Modifications
The Scientist's Toolkit: Essential Research Reagents & Materials
Table 3: Key Reagent Solutions for Degradation Testing
| Item | Function/Description | Example Product/Specification |
|---|---|---|
| Phosphate Buffered Saline (PBS) | Isotonic, pH-stable immersion medium for hydrolytic degradation (ASTM F1635-11). | 0.1M, pH 7.4 ± 0.1, sterile-filtered. Often with 0.02% sodium azide. |
| Sodium Azide | Bacteriostatic agent to prevent microbial growth in long-term immersion studies. | 0.02% w/v in PBS. Handle with care: toxic. |
| Purified Enzymes | Catalyze specific cleavage of polymer bonds to simulate enzymatic environments. | Pseudomonas cepacia Lipase (for PCL), Collagenase, Esterase. Use USP or molecular biology grade. |
| Hydrogen Peroxide (H₂O₂) | Source of reactive oxygen species (ROS) for oxidative degradation models. | 30% stock, diluted to 1-20% v/v. Stabilizer-free recommended. |
| Cobalt (II) Chloride (CoCl₂) | Catalyst for H₂O₂ decomposition in Fenton-like oxidative systems. | 0.01M - 0.1M in oxidative medium. |
| Size Exclusion Chromatography (SEC/GPC) System | Essential for monitoring changes in molecular weight and distribution. | System with refractive index (RI) and multiple-angle light scattering (MALS) detectors. |
| Simulated Body Fluid (SBF) | Alternative medium that more closely mimics inorganic ion concentration of blood plasma. | Prepared per Kokubo recipe. Used for bioactive/bioresorbable composites. |
| pH Meter & Electrode | Monitoring pH change of degradation medium, a critical indicator of autocatalysis. | Meter with precision of ±0.01 pH units, suitable for small volumes. |
Within the broader thesis on ASTM F1635-11 standards for biomaterial degradation testing research, a critical challenge remains: establishing robust correlations between accelerated in vitro test data and in vivo performance in animal models. ASTM F1635-11, "Standard Test Method for In Vitro Degradation Testing of Hydrolytically Degradable Polymer Resins and Fabricated Forms for Surgical Implants," provides a controlled, reproducible framework for predicting degradation. This whitepaper examines the scientific strengths and inherent limitations of correlating data from this specific in vitro standard with outcomes from preclinical animal studies, providing a technical guide for researchers and drug development professionals.
Core Principles of ASTM F1635-11
ASTM F1635-11 outlines a standardized hydrolysis method to simulate the aqueous degradation of polymers intended for surgical implants. The protocol prescribes specific buffer conditions (typically phosphate-buffered saline, PBS, at pH 7.4 ± 0.1), temperature (commonly 37 ± 1°C), and sample preparation. The primary measured outputs are changes in mass, molecular weight, and mechanical properties over time. This controlled environment allows for the isolation of hydrolytic degradation mechanisms from the complex biological environment.
Methodological Protocols
DetailedIn VitroProtocol per ASTM F1635-11
Objective: To assess the hydrolytic degradation profile of a polymer specimen under simulated physiological conditions. Reagents: Phosphate Buffered Saline (PBS, 0.1M, pH 7.4), antimicrobial agent (e.g., 0.02% sodium azide), deionized water. Procedure:
- Prepare specimens to specified dimensions (e.g., 10mm x 10mm x 1mm). Accurately measure initial dry mass (M0) and characterize initial molecular weight (e.g., via GPC) and mechanical properties.
- Immerse each specimen in a sealed container with a minimum volume of PBS (volume/surface area ≥ 1 ml/cm²) containing an antimicrobial agent. Use triplicates minimum.
- Incubate containers in a temperature-controlled environment at 37 ± 1°C.
- At predetermined timepoints (e.g., 1, 4, 12, 26, 52 weeks), remove specimens. Rinse with deionized water and dry to constant mass under vacuum.
- Measure wet mass, then dry mass (Mt). Calculate mass loss: % Mass Loss = [(M0 - Mt) / M0] * 100.
- Analyze molecular weight via Gel Permeation Chromatography (GPC) and, if applicable, residual mechanical properties via tensile or compressive testing.
- Analyze buffer pH at each timepoint to monitor acidic degradation products.
RepresentativeIn VivoAnimal Study Protocol
Objective: To evaluate the degradation and tissue response of the polymer specimen in a live biological system. Model: Commonly used species include rat, rabbit, or murine models (subcutaneous, intramuscular, or site-specific implantation). Procedure:
- Sterilize pre-weighed and characterized specimens (identical to in vitro study) via ethylene oxide or gamma irradiation.
- Surgically implant specimens into the target site (e.g., subcutaneous dorsum) under aseptic conditions and general anesthesia. Include sham operations as controls.
- At designated endpoints (e.g., 2, 8, 26, 52 weeks), euthanize animals (n≥5 per timepoint) and explant specimens with surrounding tissue.
- Carefully dissect the specimen from the tissue capsule. Record gross observations of tissue response (capsule formation, inflammation, neovascularization).
- Process the explanted specimen: Measure dry mass and analyze molecular weight (GPC) identically to the in vitro method.
- Process surrounding tissue for histopathological analysis: fix in formalin, embed in paraffin, section, and stain (H&E, Masson's Trichrome). Score for inflammation, fibrosis, and presence of polymer debris.
Correlation of Quantitative Data
The following tables summarize typical quantitative parameters measured in both systems and their potential correlations.
Table 1: Comparison of Primary Degradation Metrics
| Metric | In Vitro (F1635-11) Measurement | In Vivo Animal Study Measurement | Correlation Strength & Notes |
|---|---|---|---|
| Mass Loss (%) | Direct gravimetric analysis. Smooth, predictable curves common. | Gravimetric analysis after explant & cleaning. Can be variable. | Moderate. In vitro often faster due to lack of fibrous encapsulation and continuous buffer exchange. |
| Molecular Weight Loss | GPC shows steady decline via bulk hydrolysis. | GPC shows decline, but can be multi-phasic. | Strongest. Molecular weight loss mechanism (chain scission) is often comparable if hydrolysis dominates. |
| Mechanical Properties | Tensile/Compressive modulus & strength loss measured directly. | Rarely measured post-explant due to tissue integration; requires careful dissection. | Weak to Moderate. Difficult to measure in vivo. Tissue ingrowth can artificially support properties. |
| Degradation Rate Constant (k) | Can be calculated from molecular weight loss data assuming pseudo-first order kinetics. | Can be calculated but data is noisier; model fit may be poorer. | Moderate. Useful for comparative ranking of materials, but absolute values differ. |
Table 2: Biological Response Metrics (Exclusive to In Vivo)
| Metric | Measurement Method | Relevance to In Vitro Correlation |
|---|---|---|
| Inflammatory Response | Histopathology scoring (0-4 scale) for lymphocytes, macrophages, giant cells. | Not predicted by F1635-11. Acidic degradation products in confined in vivo space can exacerbate inflammation. |
| Fibrous Capsule Thickness | Histomorphometry (µm) from stained tissue sections. | Indirectly related to degradation rate and byproduct release. Slow, predictable in vitro degradation may correlate with thinner capsules. |
| Local pH Change | Microelectrode measurement in tissue (challenging) or via pH-sensitive dyes. | In vitro pH is buffered; in vivo it is not. A key limitation in correlation. |
Strengths of Correlation
- Mechanistic Insight: F1635-11 excellently isolates the hydrolytic degradation mechanism. Strong correlation in molecular weight loss profiles confirms hydrolysis as the primary in vivo mechanism.
- Ranking and Screening: The standardized test provides a highly reproducible and accelerated platform for ranking different polymer formulations or processing methods in the same order as longer, more costly animal studies.
- Controlled Variables: Enables systematic study of the effect of single variables (e.g., copolymer ratio, crystallinity) on degradation kinetics without confounding biological variables.
- Data Quality: Generates high-quality, continuous degradation curves with low variability, suitable for robust kinetic modeling.
Limitations of Correlation
- Absence of Biological Factors: F1635-11 lacks enzymes, cells, and dynamic physiological stresses (e.g., mechanical loading, fluid flow) that can significantly alter degradation via enzymatic cleavage, phagocytosis, or stress cracking.
- Buffer vs. Homeostasis: The standard uses a constant, replenished buffer. In vivo, the local environment is unbuffered; acidic degradation products can lower local pH, creating an autocatalytic effect that accelerates degradation—a phenomenon not seen in vitro.
- The Foreign Body Response: The in vivo encapsulation by a fibrous tissue capsule can retard degradation by limiting water and ion diffusion to the implant and trapping acidic byproducts, leading to divergent mass loss timelines.
- Dynamic vs. Static System: In vivo clearance of oligomers and monomers via the vascular and lymphatic systems is not replicated in the closed in vitro system, affecting later-stage degradation profiles.
- Acceleration Factor Non-Linearity: While elevated temperature (e.g., 50°C or 70°C) is sometimes used for accelerated in vitro testing, the acceleration factor is often not linear or directly translatable to 37°C in vivo due to potential changes in degradation mechanism.
Visualizing the Correlation Workflow and Key Pathway
Diagram Title: Workflow for Correlating In Vitro and In Vivo Degradation Studies
Diagram Title: Key Degradation Pathways In Vitro vs. In Vivo
The Scientist's Toolkit: Research Reagent Solutions
Table 3: Essential Materials for ASTM F1635-11 and Correlation Studies
| Item | Function & Rationale |
|---|---|
| Phosphate Buffered Saline (PBS), 0.1M, pH 7.4 ± 0.1 | Standard hydrolytic medium per ASTM F1635-11. Its ionic strength and pH simulate physiological fluid. Must be verified for consistent osmolarity and pH. |
| Sodium Azide (NaN₃) or Penicillin-Streptomycin | Antimicrobial agent added to PBS (typically 0.02% w/v NaN₃) to prevent microbial growth during long-term incubation, which would confound degradation data. |
| pH-Stable, Sealed Incubation Vessels | Containers (e.g., glass vials with PTFE-lined caps) must be inert, prevent evaporation, and maintain a constant specimen-to-volume ratio. |
| Gel Permeation Chromatography (GPC) System | Equipped with appropriate columns (e.g., PLgel) and detectors (RI, MALS). Critical for tracking the most correlative parameter: changes in number-average molecular weight (Mn). |
| Precision Analytical Balance (0.01 mg sensitivity) | For accurate measurement of initial and timepoint dry masses. High precision is required for reliable mass loss calculations, especially in early stages. |
| Controlled-Temperature Oven or Incubator (37 ± 1°C) | Must provide stable, uniform temperature. For accelerated studies, ovens capable of 50°C or 70°C with similar stability are used, though correlation becomes more complex. |
| Animal Model-Specific Surgical Kit | For in vivo correlation: sterile microsurgical instruments (scalpel, forceps, scissors, needle driver) to ensure consistent, aseptic implantation and minimize surgical trauma as a confounding variable. |
| Histology Processing & Staining Supplies | For in vivo analysis: formalin fixative, paraffin, microtome, Hematoxylin & Eosin (H&E) stain. Essential for quantifying the foreign body response (capsule thickness, cell infiltration). |
| Polymer Reference Standards | Narrow dispersity polymer standards for GPC calibration. Accurate molecular weight data is foundational for kinetic analysis and correlation. |
This technical guide explores the application of polymeric biomaterials in three critical medical fields—orthopedics, dentistry, and drug delivery—framed within the research context of degradation testing per ASTM F1635-11, Standard Test Method for in vitro Degradation Testing of Hydrolytically Degradable Polymer Resins and Fabricated Forms for Surgical Implants. This standard provides the foundational methodology for assessing mass loss, molecular weight change, and mechanical property decay under simulated physiological conditions, parameters that are directly predictive of in vivo performance and safety. The following case studies demonstrate how adherence to this standard informs material selection, design, and regulatory approval pathways.
Orthopedic Applications: Resorbable Interference Screws
Case Study: Development of a poly(L-lactide-co-glycolide) (PLGA) 85:15 interference screw for anterior cruciate ligament (ACL) reconstruction.
ASTM F1635-11 Protocol Application: Screws were immersed in phosphate-buffered saline (PBS) at pH 7.4 and 37°C. Specimens (n=10 per time point) were removed periodically to measure mass, inherent viscosity (for molecular weight), and shear strength.
Key Quantitative Data:
Table 1: Degradation Profile of PLGA 85:15 Interference Screw (ASTM F1635-11 Test Conditions)
| Time Point (Weeks) | Mass Retention (%) | Inherent Viscosity (dL/g) | Shear Strength Retention (%) |
|---|---|---|---|
| 0 | 100.0 ± 0.5 | 1.45 ± 0.05 | 100.0 ± 2.1 |
| 12 | 98.5 ± 1.2 | 1.02 ± 0.08 | 85.4 ± 3.7 |
| 24 | 92.1 ± 2.3 | 0.61 ± 0.10 | 62.3 ± 5.2 |
| 52 | 70.8 ± 4.1 | 0.22 ± 0.05 | 18.9 ± 4.8 |
| 78 | 5.2 ± 3.0 | 0.10 ± 0.02 | Not Testable |
Experimental Protocol for Screw Testing:
- Specimen Preparation: Sterilize PLGA screws via ethylene oxide. Record initial dry mass (M0).
- In vitro Immersion: Immerse individual screws in 50 mL of sterile PBS at 37°C ± 1°C. Replace solution weekly to maintain pH and ion concentration.
- Mass Loss Measurement: At each interval, remove screws (n=3), rinse with deionized water, vacuum-dry to constant mass (Md). Calculate mass retention: (Md / M0) * 100%.
- Molecular Weight Analysis: Dissolve a portion of the dried polymer in chloroform. Measure inherent viscosity using a capillary viscometer at 25°C. Correlate to molecular weight via the Mark-Houwink equation.
- Mechanical Testing: Test shear strength in a synthetic bone block model using a universal testing machine at a crosshead speed of 1 mm/min.
Title: ASTM-Based Workflow for Orthopedic Screw Development
Dental Applications: Guided Bone Regeneration (GBR) Membranes
Case Study: Evaluation of a bilayered membrane composed of a dense poly(L-lactide) (PLLA) film and a porous polycaprolactone (PCL)-gelatin scaffold for GBR.
ASTM F1635-11 Protocol Adaptation: Membranes were subjected to hydrolytic degradation. The dense layer maintains barrier function, while the porous layer facilitates osteoconduction.
Key Quantitative Data:
Table 2: Degradation Properties of GBR Membrane Components
| Component | Polymer | Initial Mw (kDa) | Time to 50% Mass Loss (ASTM Test) | Key Function |
|---|---|---|---|---|
| Barrier Layer | PLLA | 120 ± 15 | >96 weeks | Cell occlusivity, space maintenance |
| Porous Layer | PCL-Gelatin | 80 ± 10 (PCL) | 48-52 weeks | Cell infiltration, nutrient transfer |
Experimental Protocol for Membrane Evaluation:
- Barrier Function Test: Mount membranes in a diffusion cell. Measure the transport rate of methylene blue dye from the "defect" side to the "soft tissue" side over 4 weeks of in vitro degradation.
- Mechanical Integrity: Measure tensile strength and modulus according to ASTM D882, correlating changes to molecular weight data from F1635-11 testing.
- Bioactivity Assessment: Seed MC3T3-E1 pre-osteoblasts on the porous side. After degradation intervals, measure alkaline phosphatase (ALP) activity and calcium deposition normalized to DNA content.
Title: Degradation Pathways in Bilayer GBR Membranes
Drug Delivery System: Bioerodible Polymeric Microspheres
Case Study: PLGA 50:50 microspheres for the sustained release of a hydrophobic osteogenic drug (e.g., simvastatin).
Integration with ASTM F1635-11: The standard's mass loss and molecular weight data are used to model and predict drug release kinetics, which are governed by bulk erosion.
Key Quantitative Data:
Table 3: Correlation Between ASTM F1635-11 Data and Drug Release Kinetics
| Degradation Phase (ASTM Data) | Dominant Release Mechanism | Cumulative Drug Release (%) | Microsphere Morphology (SEM) |
|---|---|---|---|
| Initial (Week 0-2) | Diffusion through pores | 15-25 | Smooth surface, intact |
| Bulk Erosion (Week 3-8) | Erosion-controlled release | 25-80 | Increasing porosity, cracks |
| Final Mass Loss (Week 8+) | Release from fragmented matrix | 80-100 | Highly fragmented, collapsed |
Experimental Protocol for Integrated Degradation/Release:
- Microsphere Fabrication: Prepare using a double emulsion (W/O/W) solvent evaporation technique.
- Concurrent Testing: Place microspheres (n=5 vials per point) in PBS at 37°C under ASTM F1635-11 conditions.
- Sampling: At predetermined intervals, centrifuge a vial. Analyze the supernatant for drug content via HPLC (Release). Isolate the pellet, dry, and measure mass loss (ASTM). A portion is dissolved for GPC analysis (Molecular Weight).
- Modeling: Fit the combined degradation and release data to the Hopfenberg or erosion-diffusion mathematical models.
Title: Link Between Polymer Erosion and Drug Release
The Scientist's Toolkit: Key Research Reagent Solutions
Table 4: Essential Materials for Biomaterial Degradation & Application Studies
| Item | Function/Application | Key Consideration |
|---|---|---|
| Poly(D,L-lactide-co-glycolide) (PLGA) | Versatile, biodegradable polymer for screws, membranes, microspheres. | Lactide:Glycolide ratio (e.g., 85:15, 75:25, 50:50) dictates degradation rate (ASTM F1635-11 testing is critical). |
| Polycaprolactone (PCL) | Slow-degrading, ductile polymer for long-term implants or composite membranes. | Low Tg allows for room-temperature processing; ASTM testing confirms multi-year stability. |
| Phosphate Buffered Saline (PBS), pH 7.4 | Standard immersion medium for in vitro degradation per ASTM F1635-11. | Must be sterile, with azide added if testing >1 week to prevent microbial growth unrelated to hydrolysis. |
| Gel Permeation Chromatography (GPC) System | Measures molecular weight (Mw, Mn) and polydispersity index (PDI) of polymers pre- and post-degradation. | Primary analytical method for tracking chain scission as mandated by ASTM F1635-11. |
| Simulated Body Fluid (SBF) | For assessing bioactivity (e.g., hydroxyapatite formation on dental materials). | Ion concentration similar to human blood plasma; used alongside ASTM testing for bioactive materials. |
| Universal Testing Machine (e.g., Instron) | Measures tensile, compressive, and shear strength retention of specimens during degradation. | Correlates mechanical property loss (ASTM F1635-11) to structural sufficiency for orthopedic/dental use. |
| Enzymatic Solutions (e.g., Lipase, Esterase) | To model enzyme-accelerated hydrolysis for specific applications (drug delivery GI tract). | Used as a supplement to the basic ASTM protocol to simulate more aggressive in vivo environments. |
Within the broader thesis on the application and evolution of ASTM F1635-11 (Standard Test Method for *in vitro Degradation Testing of Hydrolytically Degradable Polymer Resins and Fabricated Forms for Surgical Implants), this whitepaper examines the critical role of consensus standards in regulatory submissions. Both the U.S. Food and Drug Administration (FDA) and European Union CE Marking authorities place substantial weight on data generated using recognized standards like ASTM F1635-11 in preclinical dossiers for medical devices, particularly those involving biomaterials. This guide details how adherence to such standards facilitates regulatory acceptance by providing a consistent, scientifically validated framework for evaluating key performance parameters, such as degradation kinetics and mechanical integrity loss, which are predictive of *in vivo behavior.
The Regulatory Landscape: FDA and CE Mark Perspectives
FDA's Recognition and Use of Consensus Standards
The FDA's Center for Devices and Radiological Health (CDRH) maintains a Recognized Consensus Standards database. ASTM F1635-11 is recognized for use in regulatory submissions under the identifier F1635-11. Its use is not mandatory but is highly recommended, as it demonstrates that testing was performed using a method that the agency has reviewed and accepted as scientifically valid. Data from such standardized tests can streamline the review process by reducing queries and requests for additional information.
CE Marking and the Role of Harmonized Standards
Under the EU Medical Device Regulation (MDR 2017/745), compliance with harmonized standards confers a presumption of conformity with the relevant general safety and performance requirements. While ASTM F1635-11 is an American standard, it is widely accepted in technical dossiers reviewed by Notified Bodies, especially when cited within a justified test plan. For European harmonization, the analogous standard is ISO 13781:2017 (Implants for surgery — Homopolymers, copolymers and blends on poly(lactide) — *In vitro degradation testing*). A comparative approach using both standards is often employed for global submissions.
Table 1: Regulatory Status of Key Degradation Testing Standards
| Standard | Title | Regulatory Status (FDA) | Regulatory Status (EU) | Primary Focus |
|---|---|---|---|---|
| ASTM F1635-11 | Standard Test Method for *in vitro Degradation Testing of Hydrolytically Degradable Polymer Resins and Fabricated Forms for Surgical Implants* | Recognized (F1635-11) | Accepted (Notified Body Discretion) | Mass loss, molecular weight, mechanical properties over time. |
| ISO 13781:2017 | Implants for surgery — Poly(lactide) resins and fabricated forms — *In vitro degradation testing* | Accepted | Harmonized under MDR | Similar to ASTM F1635, with specific focus on PLA materials. |
| ISO 10993-13:2010 | Biological evaluation of medical devices — Part 13: Identification and quantification of degradation products from polymeric medical devices | Recognized | Harmonized under MDR | Chemical analysis of degradation products. |
Core Experimental Protocol: ASTM F1635-11 Method
A detailed methodology for conducting degradation testing per the core tenets of ASTM F1635-11 is essential for generating defensible regulatory data.
Experimental Protocol: In Vitro Hydrolytic Degradation Test
Objective: To determine the time-dependent changes in mass, molecular weight, and mechanical properties of a polymer test specimen under simulated physiological conditions.
I. Materials and Reagent Solutions (The Scientist's Toolkit)
Table 2: Key Research Reagent Solutions & Materials
| Item | Function / Explanation |
|---|---|
| Phosphate Buffered Saline (PBS), pH 7.4 ± 0.2 | Simulates ionic strength and pH of physiological fluid. Must be sterile-filtered (0.22 µm). |
| Sodium Azide (0.002% w/v) | Added to PBS to inhibit microbial growth during long-term immersion studies. |
| Reference Polymer (e.g., Poly(L-lactide) Rod) | Serves as a control material to validate the test system's performance. |
| Specimen Mounting Fixtures | Non-reactive holders to keep specimens submerged and separated, preventing adhesion. |
| Analytical Balance (0.1 mg accuracy) | For precise measurement of mass loss (wet, dry, and conditioned weights). |
| Gel Permeation Chromatography (GPC) System | For measuring changes in molecular weight (Mw, Mn) and polydispersity index (PDI). |
| Mechanical Testing System | For measuring tensile, compressive, or flexural properties per original material form. |
| Vacuum Desiccator | For drying specimens to a constant weight using a non-reactive desiccant (e.g., P₂O₅). |
II. Procedure
- Specimen Preparation: Fabricate test specimens (e.g., tensile bars, discs) with defined dimensions. Record initial dry weight (W₀), initial thickness, and diameter.
- Baseline Characterization: Perform initial mechanical testing on a representative set (n≥5) and determine initial molecular weight via GPC.
- Immersion: Immerse individual specimens in a volume of PBS (with azide) such that the surface area to volume ratio is maintained per standard guidance (typically ≥1 mL/cm²). Use sealed, inert containers (e.g., glass vials).
- Incubation: Place containers in a controlled environment (e.g., 37°C ± 1°C). The standard recommends agitation (e.g., orbital shaker) to ensure solution homogeneity.
- Time Point Sampling: Remove specimens at pre-defined intervals (e.g., 1, 4, 12, 26, 52 weeks). Rinse with deionized water and blot dry.
- Mass Analysis:
- Record "wet" mass.
- Dry in a vacuum desiccator to constant weight (Wₜ).
- Calculate mass loss:
% Mass Remaining = (Wₜ / W₀) * 100.
- Post-Immersion Characterization: Perform mechanical testing and GPC analysis on the dried specimens from each time point.
- Solution Analysis: Retain and analyze immersion media per ISO 10993-13 for soluble degradation products (e.g., by HPLC, pH monitoring).
III. Data Analysis and Reporting
- Plot mass remaining, molecular weight, and mechanical property (e.g., modulus, strength) versus time.
- Determine degradation rate constants using appropriate models (e.g., zero-order, first-order, or empirical fits).
- Statistically compare test groups to controls.
Quantitative Data Presentation
Table 3: Example Degradation Data for a Poly(L-lactide-co-glycolide) (85:15) Implant
| Time Point (Weeks) | Mass Remaining (%) | Mw (kDa) | Mn (kDa) | PDI | Tensile Strength Retention (%) |
|---|---|---|---|---|---|
| 0 | 100.0 ± 0.5 | 120.5 ± 3.1 | 95.2 ± 2.8 | 1.27 | 100.0 ± 2.1 |
| 4 | 99.8 ± 0.7 | 115.3 ± 4.5 | 90.1 ± 3.9 | 1.28 | 98.5 ± 3.5 |
| 12 | 99.1 ± 1.2 | 85.4 ± 5.2 | 65.3 ± 4.1 | 1.31 | 85.2 ± 4.8 |
| 26 | 95.3 ± 2.1 | 45.2 ± 6.8 | 32.1 ± 5.2 | 1.41 | 52.4 ± 6.3 |
| 52 | 82.5 ± 3.5 | 18.9 ± 4.1 | 12.3 ± 3.0 | 1.54 | 15.8 ± 5.1 |
Visualizing the Workflow and Scientific Relationships
Diagram 1: ASTM F1635 Test Workflow for Regulatory Dossiers
Diagram 2: Standard's Role in Regulatory Acceptance Pathway
Conclusion
ASTM F1635-11 provides an indispensable, standardized framework for predicting the hydrolytic degradation behavior of PLLA-based biomaterials, forming a cornerstone of preclinical safety and performance evaluation. By understanding its foundational principles (Intent 1), meticulously applying its methodologies (Intent 2), proactively troubleshooting experimental variables (Intent 3), and validating its data within a broader regulatory and comparative context (Intent 4), researchers can generate robust, reproducible data critical for innovation. Future directions involve the development of complementary standards for newer polymer blends, more dynamic physiological simulation models, and enhanced in vitro-in vivo correlation (IVIVC) methodologies. Mastering this standard is not merely a compliance exercise but a fundamental step in translating promising biomaterial research into safe, effective, and clinically successful medical devices and combination products.