Active vs. Passive Targeting in Nanomedicine: Mechanisms, Clinical Applications, and Future Directions
This comprehensive review explores the fundamental principles, methodologies, and comparative efficacy of active and passive targeting strategies in nanomedicine.
Active vs. Passive Targeting in Nanomedicine: Mechanisms, Clinical Applications, and Future Directions
Abstract
This comprehensive review explores the fundamental principles, methodologies, and comparative efficacy of active and passive targeting strategies in nanomedicine. Tailored for researchers and drug development professionals, the article delves into the underlying biological mechanisms of the Enhanced Permeability and Retention (EPR) effect and receptor-mediated targeting. It examines current synthesis and conjugation techniques, addresses critical challenges in tumor heterogeneity and immunogenicity, and validates strategies through preclinical and clinical case studies. By synthesizing recent advancements, this analysis provides a roadmap for optimizing next-generation targeted nanotherapeutics and translating them into clinical practice.
Understanding the Core Mechanisms: EPR Effect vs. Molecular Recognition
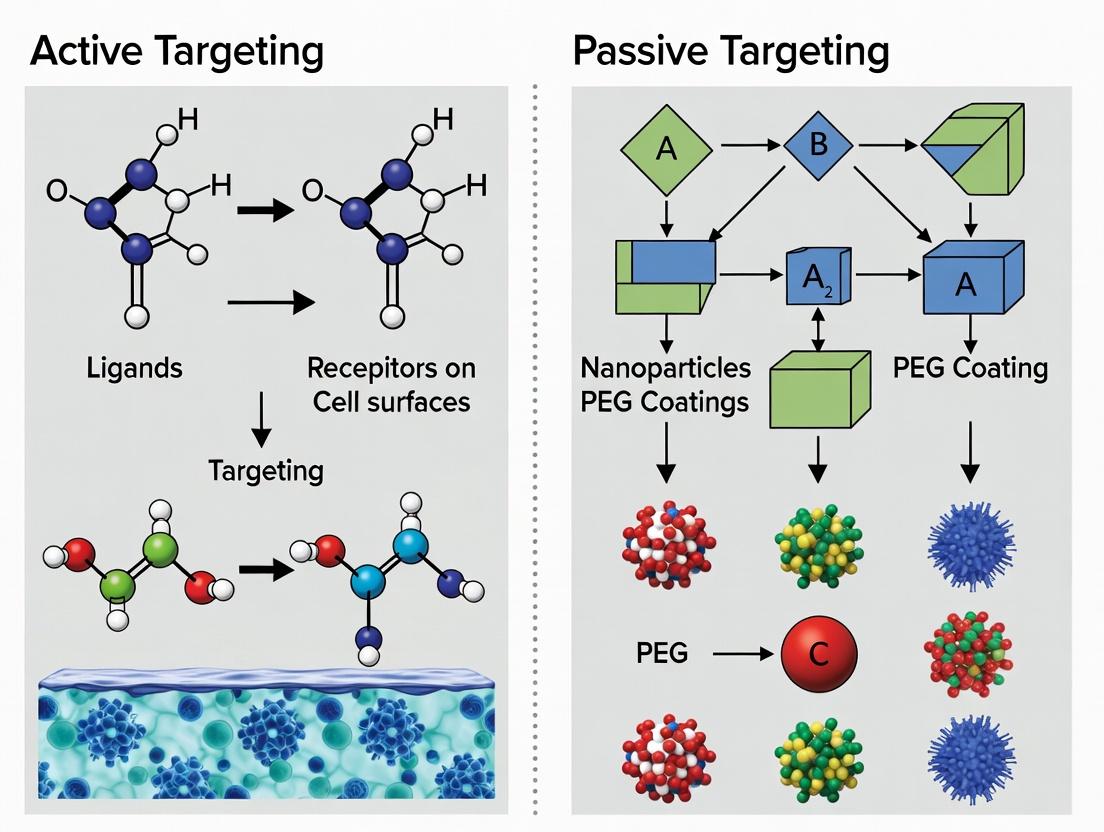
Within the strategic framework of nanomedicine drug delivery, the concept of "targeting" is bifurcated into two principal paradigms: active and passive. Active targeting involves the functionalization of a nanocarrier with ligands (e.g., antibodies, peptides, aptamers) that bind specifically to receptors overexpressed on target cells, facilitating receptor-mediated endocytosis. In contrast, passive targeting relies on the intrinsic physicochemical properties of the nanocarrier (size, surface charge, hydrophobicity) to exploit the unique pathophysiological features of diseased tissues, most notably in solid tumors. The cornerstone of passive targeting is the Enhanced Permeability and Retention (EPR) effect, first systematically described by Matsumura and Maeda in 1986. This whitepaper provides an in-depth technical guide to the EPR effect, its mechanisms, quantitative characterization, and experimental validation.
The Core Mechanism of the EPR Effect
The EPR effect is a pathophysiological phenomenon that enables macromolecules and nanoparticles (typically 10-200 nm in size) to accumulate preferentially in tumor tissue compared to normal tissues. This occurs through a two-step process:
- Enhanced Permeability: Tumor angiogenesis produces blood vessels that are structurally abnormal—fenestrated, discontinuous, and lacking proper pericytes and smooth muscle coverage. This defective architecture, coupled with overexpressed vascular mediators like Vascular Endothelial Growth Factor (VEGF), bradykinin, and nitric oxide, creates gaps (100 nm to 2 µm) in the vascular endothelium. This allows for the extravasation of circulating nanomedicines.
- Retention: Tumors frequently exhibit impaired lymphatic drainage due to rapid growth that compresses or obliterates lymphatic vessels. Consequently, extravasated nanoparticles and macromolecules are not efficiently cleared and are "retained" in the tumor interstitium for prolonged periods.
Diagram Title: The EPR Effect: Comparison of Normal vs. Tumor Vasculature
Quantitative Parameters & Key Data
The efficiency of the EPR effect is quantified using several key pharmacokinetic and biodistribution parameters. The following table summarizes critical quantitative data from recent studies and established benchmarks.
Table 1: Key Quantitative Parameters for Characterizing the EPR Effect
| Parameter | Typical Range/Value in Tumors (vs. Normal Tissue) | Measurement Method | Interpretation |
|---|---|---|---|
| Tumor Vascular Pore Size | 100 - 2000 nm (vs. <10 nm in normal tissue) | Intravital microscopy, perfusion with fluorescent probes of varying sizes. | Defines the upper size limit for nanoparticle extravasation. |
| Tumor Accumulation (%ID/g)* | 3 - 10% ID/g (can be <1% ID/g in normal tissue) | Radiolabeling (e.g., ¹²⁵I, ¹¹¹In) or fluorescent dye quantification ex vivo. | Percent of Injected Dose per gram of tissue. Higher values indicate greater passive targeting. |
| Tumor-to-Blood Ratio (T/B) | 3 - 10 (at 24-48 h post-injection) | Ratio of nanoparticle concentration in tumor vs. blood at specific time points. | Values >1 indicate selective tumor accumulation. |
| Tumor-to-Muscle Ratio (T/M) | 5 - 50+ | Ratio of nanoparticle concentration in tumor vs. muscle. | Muscle is a common control for well-perfused, non-leaky tissue. High T/M is a hallmark of EPR. |
| Plasma Half-life (t₁/₂) | 10 - 30 hours (for PEGylated nanoparticles) | Pharmacokinetic analysis of blood samples over time. | Long circulation is prerequisite for EPR; short t₁/₂ leads to clearance before extravasation. |
| Area Under Curve (AUC) | Significantly higher for long-circulating NPs | Integration of the plasma concentration-time curve. | Reflects total systemic exposure, correlating with EPR potential. |
*%ID/g = Percent of Injected Dose per gram of tissue.
Experimental Protocol: Validating the EPR EffectIn Vivo
Objective: To quantify the passive tumor targeting of a PEGylated liposomal formulation (e.g., Doxil analogue) via the EPR effect in a murine subcutaneous xenograft model.
Materials & Reagents:
- Animal Model: Immunodeficient mice (e.g., BALB/c nude or SCID) bearing a subcutaneous human carcinoma xenograft (e.g., HT-29, MDA-MB-231) of ~200-500 mm³ volume.
- Test Article: Fluorescently labeled (e.g., DiR, Cy5.5) or ¹¹¹In/⁶⁴Cu-radiolabeled PEGylated liposomes (size: ~100 nm, PDI <0.1).
- Control: Saline or non-PEGylated ("conventional") liposomes.
Procedure:
- Preparation: Characterize nanoparticles for size (DLS), zeta potential, and labeling efficiency.
- Administration: Via tail vein, inject a single dose (e.g., 5 mg lipid/kg or 100 µCi radioactivity) into tumor-bearing mice (n=5-7 per group).
- In Vivo Imaging (Optional): At predetermined time points (1, 4, 24, 48 h), anesthetize mice and acquire whole-body fluorescence (IVIS) or PET/SPECT images.
- Tissue Harvest & Biodistribution: At terminal time points (e.g., 24 and 48 h), euthanize animals. Collect blood via cardiac puncture. Harvest tumor, liver, spleen, kidneys, heart, lungs, and a muscle sample (e.g., quadriceps). Weigh all tissues.
- Quantification:
- For Fluorescent Probes: Homogenize tissues, extract dye with appropriate solvent, and measure fluorescence with a plate reader. Compare to a standard curve of the injected formulation.
- For Radiolabels: Count tissue radioactivity using a gamma counter.
- Data Analysis: Calculate %ID/g and T/B, T/M ratios for each animal. Perform statistical analysis (e.g., Student's t-test) between experimental and control groups.
Diagram Title: *In Vivo EPR Effect Validation Workflow*
The Scientist's Toolkit: Key Research Reagent Solutions
Table 2: Essential Materials for EPR Effect Research
| Research Reagent / Material | Function / Purpose | Example Product/Category |
|---|---|---|
| PEGylated Lipid Nanoparticles | Model long-circulating nanocarrier; backbone for studying EPR. | DSPE-PEG2000 liposomes, PEG-PLGA nanoparticles. |
| Fluorescent Lipophilic Dyes (DiR, DiD) | Hydrophobic tracers for stable incorporation into lipid bilayers for in vivo imaging. | DiR (1,1'-dioctadecyl-3,3,3',3'-tetramethylindotricarbocyanine iodide). |
| NIR Fluorophores (Cy5.5, IRDye800CW) | Covalent conjugation to nanoparticles for high-sensitivity, low-background fluorescence imaging. | Cy5.5 NHS Ester. |
| Radiolabels for PET/SPECT (⁶⁴Cu, ¹¹¹In, ⁹⁹ᵐTc) | Provide highly quantitative, tomographic biodistribution data. | ⁶⁴CuCl₂ (for chelation labeling), ¹¹¹In-oxine. |
| Matrigel Basement Membrane Matrix | For establishing orthotopic or primary tumor models with more representative vasculature. | Corning Matrigel. |
| VEGF / Inflammatory Cytokines | To induce or enhance vascular permeability in experimental models. | Recombinant murine VEGF-165. |
| Intravital Microscopy Setup | Direct real-time visualization of nanoparticle extravasation in live animals. | Includes dorsal skinfold chamber or cranial window, confocal/multiphoton microscope. |
Clinical Relevance and Heterogeneity of the EPR Effect
It is critical to note that the EPR effect exhibits significant inter- and intra-tumor heterogeneity in human patients, influenced by factors such as tumor type, location, stage, and individual patient physiology. This heterogeneity is a major challenge in translating passive targeting from robust murine models to consistent clinical outcomes. Strategies to overcome this limitation include:
- Priming the Tumor: Using radiation or vascular modulating agents (e.g., TNF-α, VEGF inhibitors in metronomic dosing) to temporarily enhance vascular permeability.
- Patient Stratification: Developing imaging biomarkers (e.g., dynamic contrast-enhanced MRI) to identify patients with high-EPR tumors likely to respond to nanomedicines.
The EPR effect remains the fundamental principle enabling passive targeting in oncology nanomedicine. While its conceptual simplicity is powerful, its practical application requires meticulous nanoparticle design (optimizing size, surface charge, and stealth properties) and a nuanced understanding of its variability. As the field advances, integrating passive EPR-based targeting with active ligand-mediated strategies represents a promising synergistic approach to improve the precision and efficacy of next-generation nanotherapeutics.
Active targeting, a cornerstone of modern nanomedicine, strategically employs ligand-receptor interactions to direct therapeutic agents to specific cell populations. This approach stands in contrast to passive targeting, which relies primarily on the Enhanced Permeability and Retention (EPR) effect for tumor accumulation. The efficacy of active targeting hinges on the precise molecular recognition between a surface-bound ligand on a nanocarrier and its cognate receptor overexpressed on target cells. This whitepaper delves into the biological underpinnings of these interactions, emphasizing specificity, affinity, and the subsequent intracellular signaling and trafficking events, within the broader thesis of optimizing nanomedicine delivery strategies.
Fundamental Principles of Ligand-Receptor Interactions
The specificity of active targeting is governed by the lock-and-key paradigm of ligand-receptor binding, quantified by the dissociation constant (KD). High-affinity interactions (low nM to pM KD) are typically desired, but must be balanced against the "binding-site barrier" effect, where excessively high affinity can limit tissue penetration.
Table 1: Common Ligand-Receptor Pairs in Active Targeting Nanomedicine
| Ligand Class | Example Ligand | Target Receptor | Common Expression Profile | Typical KD Range | Primary Application Focus |
|---|---|---|---|---|---|
| Monoclonal Antibody | Trastuzumab | HER2/ErbB2 | Breast, gastric cancer | 0.1 - 1 nM | Oncology |
| Antibody Fragment | scFv (anti-EGFR) | Epidermal Growth Factor Receptor (EGFR) | NSCLC, colorectal, HNSCC | 1 - 10 nM | Oncology |
| Peptide | RGD (Arginine-Glycine-Aspartic acid) | αvβ3 Integrin | Angiogenic endothelium, glioblastoma | 1 - 1000 nM | Oncology, Cardiovascular |
| Aptamer | AS1411 | Nucleolin | Various cancer cell surfaces | 10 - 100 nM | Oncology |
| Vitamin | Folic Acid | Folate Receptor (FR-α) | Ovarian, lung, endometrial cancer | 0.1 - 1 nM | Oncology |
| Carbohydrate | Hyaluronic Acid | CD44 | Various cancers, stem cells | 10 - 100 nM | Oncology |
Key Signaling Pathways Activated Upon Receptor Engagement
Ligand binding often triggers receptor-mediated endocytosis and can activate downstream signaling cascades that influence therapeutic outcomes. Understanding these pathways is critical for predicting nanocarrier fate and potential off-target effects.
Diagram 1: Receptor Tyrosine Kinase (RTK) Mediated Endocytosis & Signaling
Experimental Protocols for Evaluating Targeting Specificity
Protocol: In Vitro Cell Binding and Internalization Assay (Flow Cytometry)
Objective: Quantify specific cellular association and uptake of ligand-targeted nanoparticles. Materials: Target cell line (e.g., A549, high EGFR), isogenic control line (low EGFR), fluorescently labeled targeted nanoparticles (NP-Ligand), fluorescently labeled non-targeted nanoparticles (NP-Control). Procedure:
- Seed cells in 12-well plates at 2.5 x 10^5 cells/well and culture for 24h.
- Wash cells with ice-cold PBS (pH 7.4).
- For Binding (4°C): Incubate cells with NP-Ligand or NP-Control (e.g., 100 µM lipid concentration) in serum-free media for 1h on ice to inhibit endocytosis.
- For Internalization (37°C): Repeat step 3 at 37°C for 1h.
- Wash cells 3x with cold PBS to remove unbound nanoparticles.
- Trypsinize cells, resuspend in PBS + 1% BSA, and analyze immediately via flow cytometry (e.g., 10,000 events per sample).
- Competition Assay: Pre-incubate cells with a 100-fold excess of free ligand for 30 min before adding NP-Ligand at 37°C. Data Analysis: Report geometric mean fluorescence intensity (MFI). Specific binding = (MFINP-Ligand, 4°C - MFINP-Control, 4°C). Specific internalization = (MFINP-Ligand, 37°C - MFINP-Ligand+Free Ligand, 37°C).
Protocol: Determination of Apparent Binding Affinity (Surface Plasmon Resonance - SPR)
Objective: Measure the kinetic rate constants (kon, koff) and equilibrium dissociation constant (KD) for ligand-receptor interaction. Materials: SPR instrument (e.g., Biacore), CMS sensor chip, purified recombinant target receptor, ligand (or ligand-conjugated small molecule for immobilization), running buffer (e.g., HBS-EP: 10 mM HEPES, 150 mM NaCl, 3 mM EDTA, 0.005% v/v Surfactant P20, pH 7.4). Procedure:
- Immobilization: Activate CMS chip carboxyl groups via EDC/NHS chemistry. Covalently immobilize the receptor (or ligand) onto the sensor chip surface to a density of ~50-100 Response Units (RU). Deactivate excess esters with ethanolamine.
- Ligand Injection: Serially dilute the analyte (ligand if receptor is immobilized, or vice versa) in running buffer (e.g., 0.1 nM to 100 nM). Inject each concentration over the active and reference flow cells for 120s (association phase) at a flow rate of 30 µL/min.
- Dissociation: Switch to running buffer only for 300s (dissociation phase).
- Regeneration: Inject a mild regeneration buffer (e.g., 10 mM Glycine-HCl, pH 2.0) for 30s to remove bound analyte without damaging the immobilized biomolecule.
- Data Processing: Subtract reference cell signal. Fit the resulting sensorgrams globally to a 1:1 Langmuir binding model using the instrument's software to calculate kon (M-1s-1), koff (s-1), and KD = koff/kon.
The Scientist's Toolkit: Key Research Reagent Solutions
Table 2: Essential Materials for Active Targeting Research
| Reagent/Material | Supplier Examples | Function in Research |
|---|---|---|
| Recombinant Human Receptors | R&D Systems, Sino Biological, AcroBiosystems | Used for SPR affinity measurements, cell-free binding assays, and as positive controls in western blotting. |
| Ligand Conjugation Kits | BroadPharm, Click Chemistry Tools, Thermo Fisher (SMCC, NHS-PEG-Maleimide) | Facilitate covalent attachment of targeting ligands (peptides, antibodies, folate) to nanoparticle surfaces or fluorophores. |
| Fluorescent Liposomes/Nanoparticles | FormuMax, Avanti Polar Lipids, Creative Biostructure (Custom synthesis) | Pre-formed, customizable nanocarriers for in vitro and in vivo targeting and uptake studies. |
| Isogenic Cell Line Pairs | ATCC, Horizon Discovery | Paired cell lines (e.g., high vs. low receptor expression) are critical controls for demonstrating targeting specificity. |
| In Vivo Imaging Dyes (e.g., DiR, Cy7) | Lumiprobe, PerkinElmer | For non-invasive tracking of targeted nanoparticle biodistribution in animal models. |
| 3D Tumor Spheroid Kits | Corning, Cellendes, Insphero | Provide a more physiologically relevant in vitro model than 2D culture for testing nanoparticle penetration and targeting. |
| Protease Inhibitor Cocktails | Roche, Sigma-Aldrich | Prevent ligand degradation or receptor shedding during cell-based assays and sample preparation. |
Quantitative Data on Targeting Efficacy
Table 3: Comparative Efficacy of Active vs. Passive Targeting in Preclinical Models
| Nanoparticle Formulation | Target (Ligand) | Model System | Key Metric | Passive Targeting Result | Active Targeting Result | Fold Improvement | Reference (Example) |
|---|---|---|---|---|---|---|---|
| Liposomal Doxorubicin | HER2 (Trastuzumab Fab') | BT-474 (Breast Ca) Xenograft | Tumor Accumulation (%ID/g) | 3.2 ± 0.5 %ID/g | 8.1 ± 1.2 %ID/g | ~2.5x | (Sapra et al., 2005) |
| Polymeric NP (PLGA) | EGFR (Cetuximab) | HCT-116 (Colorectal) Xenograft | Tumor-to-Muscle Ratio (TMR) | 4.5 ± 0.8 | 12.3 ± 2.1 | ~2.7x | (Song et al., 2021) |
| Gold Nanorods | αvβ3 Integrin (RGD Peptide) | U87MG (Glioblastoma) Xenograft | Photothermal Therapy Survival | Median: 28 days | Median: >60 days | >2.1x | (You et al., 2022) |
| siRNA Lipid Nanoparticles | Transferrin Receptor (TfR mAb) | Orthotopic Liver Cancer | Gene Silencing in Tumor | 25% mRNA knockdown | 80% mRNA knockdown | ~3.2x | (Khan et al., 2023) |
| Micellar Docetaxel | PSMA (Small Molecule) | LNCaP (Prostate) Xenograft | Tumor Growth Inhibition (TGI) | 68% TGI | 92% TGI | ~1.35x (vs. passive) | (Zhou et al., 2020) |
Diagram 2: Workflow for Developing & Validating Actively Targeted Nanomedicines
The biology of active targeting is defined by the sophisticated interplay of ligand-receptor kinetics, signaling cascades, and intracellular trafficking. Achieving true specificity requires rigorous in vitro and in vivo validation, as detailed in the provided protocols. While data clearly demonstrates the potential for active targeting to enhance therapeutic indices over passive mechanisms, its success is context-dependent, influenced by target selection, ligand affinity, and physiological barriers. This foundational understanding is critical for advancing the next generation of targeted nanomedicines.
The efficacy of nanomedicine hinges on a two-tiered journey: first, the nanoparticle must navigate the systemic circulation to reach the target tissue (passive targeting via the Enhanced Permeability and Retention effect), and second, it must be internalized by specific cells via defined cellular uptake pathways (active targeting). This whitepaper dissects the fundamental differences between these sequential, interconnected phases, emphasizing that successful drug delivery requires optimization for both distinct biological environments.
Systemic Circulation: The Macro-Transport Highway
This phase involves the bulk transport of nanoparticles from the administration site through the cardiovascular system to the target tissue's vasculature.
2.1 Core Parameters & Challenges:
- Hydrodynamic Diameter: Dictates renal clearance (<5-6 nm) and hepatic sinusoidal filtration.
- Surface Charge (Zeta Potential): Impacts opsonization and clearance by the Mononuclear Phagocyte System (MPS).
- Protein Corona Formation: Dynamic adsorption of serum proteins defines biological identity and fate.
- Hemodynamic Forces: Shear stress influences margination and endothelial interaction.
2.2 Quantitative Data Summary:
Table 1: Key Parameters Governing Nanoparticle Fate in Systemic Circulation
| Parameter | Typical Optimal Range (for Long Circulation) | Critical Threshold/Effect | ||
|---|---|---|---|---|
| Hydrodynamic Diameter | 10 - 100 nm | <6 nm: Rapid renal clearance; >200 nm: Increased MPS sequestration. | ||
| Polyethylene Glycol (PEG) Density | 0.5 - 5 PEG chains per nm² | >20% surface coverage significantly reduces protein adsorption. | ||
| Zeta Potential | Near-neutral (-10 to +10 mV) | Strongly positive or negative (> | ±20 | mV) increases opsonization. |
| Blood Circulation Half-life (in mice) | 12 - 24 hours (for optimized PEGylated NPs) | Uncoated, charged NPs: Minutes to a few hours. |
2.3 Experimental Protocol: Measuring Blood Circulation Half-life
- Objective: Determine the pharmacokinetic profile of intravenously administered nanoparticles.
- Method:
- Synthesize nanoparticles incorporating a near-infrared (NIR) fluorophore (e.g., Cy5.5) or radiolabel (e.g., ¹¹¹In).
- Administer a known dose intravenously to animal models (e.g., mice) via tail vein.
- Collect blood samples (e.g., 5 µL) from the retro-orbital plexus or tail nick at predetermined time points (e.g., 2 min, 15 min, 1h, 4h, 12h, 24h, 48h).
- Lyse blood cells and quantify nanoparticle signal in each sample using fluorescence spectroscopy or gamma counting.
- Plot concentration (as % injected dose per gram of blood, %ID/g) vs. time. Fit data to a two-compartment pharmacokinetic model to calculate alpha and beta half-lives.
Cellular Uptake Pathways: The Micro-Transport Gateways
This phase encompasses the specific mechanisms by which cells internalize nanoparticles after extravasation or contact.
3.1 Core Pathways & Determinants:
- Endocytosis: The primary route for nanocarrier internalization.
- Clathrin-Mediated Endocytosis (CME): Receptor-specific, size-limited (~120 nm).
- Caveolae-Mediated Endocytosis: Involves lipid raft domains, smaller vesicles (~60 nm).
- Macropinocytosis: Actin-driven, non-specific uptake of large volumes (>1 µm).
- Phagocytosis: Professional uptake by immune cells (macrophages, neutrophils).
- Key Determinants: Surface ligand/receptor affinity, nanoparticle size, shape, and rigidity.
3.2 Quantitative Data Summary:
Table 2: Characteristics of Major Cellular Uptake Pathways
| Pathway | Primary Size Range | Ligand Dependency | Intracellular Fate/Destination |
|---|---|---|---|
| Clathrin-Mediated | < 120 nm | High (Receptor-specific) | Early Endosome → Lysosome (typically) |
| Caveolae-Mediated | ~ 60 nm | Moderate (Lipid raft-associated) | Caveosome → Endoplasmic Reticulum/Golgi (often lysosome-avoidant) |
| Macropinocytosis | > 500 nm | Low (Fluid-phase) | Macropinosome → Lysosome |
| Phagocytosis | > 500 nm | High (Opsonin or specific receptor) | Phagosome → Lysosome |
3.3 Experimental Protocol: Pharmacological Inhibition of Endocytic Pathways
- Objective: Identify the dominant pathway for nanoparticle internalization in a given cell line.
- Method:
- Culture adherent cells (e.g., HeLa, HUVEC) in 24-well plates.
- Pre-treat cells for 30-60 minutes with pathway-specific inhibitors:
- CME: Chlorpromazine (10 µg/mL) or Pitstop 2 (30 µM).
- Caveolae: Methyl-β-cyclodextrin (5 mM) to deplete cholesterol, or Genistein (200 µM).
- Macropinocytosis: EIPA (50 µM, inhibits Na⁺/H⁺ exchange).
- Actin Polymerization (general): Cytochalasin D (2 µM).
- Add fluorescently labeled nanoparticles to cells (in continued inhibitor presence) and incubate for 2-4 hours at 37°C.
- Wash cells thoroughly, trypsinize, and analyze internalized fluorescence via flow cytometry. Normalize data to untreated control cells to calculate % inhibition of uptake.
Visualizing the Sequential Journey and Key Pathways
Diagram 1: Sequential Journey from Circulation to Uptake (93 chars)
Diagram 2: Key Cellular Endocytic Pathways (79 chars)
The Scientist's Toolkit: Key Research Reagents & Materials
Table 3: Essential Reagents for Studying Circulation and Uptake
| Reagent/Material | Primary Function | Application Context |
|---|---|---|
| PEGylated Phospholipids (e.g., DSPE-PEG) | Creates steric "stealth" coating on nanoparticles. | Minimizing opsonization, prolonging systemic circulation half-life. |
| Targeting Ligands (e.g., Folate, RGD peptide, anti-HER2 affibody) | Mediates specific binding to overexpressed cell surface receptors. | Active targeting to enhance cellular internalization via receptor-mediated endocytosis. |
| Endocytic Pathway Inhibitors (Chlorpromazine, EIPA, Genistein) | Pharmacologically blocks specific internalization mechanisms. | Elucidating the dominant cellular uptake pathway for a nanoparticle formulation. |
| Fluorescent Probes (DiD, Cy5.5, FITC) | Covalently or physically incorporated into nanoparticles for tracking. | Quantitative analysis of biodistribution (IVIS, FRI) and cellular uptake (flow cytometry, confocal microscopy). |
| Dynamin Inhibitors (Dynasore) | Blocks scission of endocytic vesicles from plasma membrane. | Confirming endocytic (vs. non-endocytic) uptake mechanism. |
| Lysotracker / Early Endosome Marker (EEA1 Antibody) | Stains acidic lysosomal compartments or early endosomes. | Co-localization studies to determine intracellular trafficking fate post-uptake. |
The central thesis in modern oncological nanomedicine revolves around two divergent targeting philosophies: active targeting, which relies on the specific molecular recognition of tumor cells or their microenvironmental components via ligand-receptor interactions, and passive targeting, which exploits the pathophysiological irregularities of solid tumors, primarily the Enhanced Permeability and Retention (EPR) effect. The tumor microenvironment (TME) is no longer viewed as a passive bystander but as a dynamic, complex entity that profoundly influences therapeutic efficacy. It presents a battleground where both active and passive targeting strategies must contend with and leverage TME components—such as abnormal vasculature, dense extracellular matrix (ECM), immunosuppressive cells, and aberrant signaling pathways—to achieve successful drug delivery and action.
Deconstructing the TME: Components and Quantitative Profiles
The TME's composition is highly heterogeneous, both between cancer types and within a single tumor. Key quantitative characteristics are summarized below.
Table 1: Quantitative Profile of Core TME Components
| TME Component | Key Characteristic | Typical Range/Value | Impact on Targeting |
|---|---|---|---|
| Vasculature | Pore Cut-off Size | 100 - 780 nm (variable) | Dictates nanoparticle size for passive EPR. |
| Interstitial Fluid Pressure (IFP) | Elevated Pressure | 5 - 40 mmHg (vs. ~0 mmHg normal) | Creates outward convective flow, hindering inward diffusion. |
| Extracellular Matrix (ECM) | Collagen Density | 1.5 - 3x increase vs. normal tissue | Increases stiffness, forms physical barrier to diffusion. |
| Cancer-Associated Fibroblasts (CAFs) | Prevalence in Carcinoma | Up to 80% of tumor mass | Secretes ECM, modulates signaling, influences drug resistance. |
| Tumor-Associated Macrophages (TAMs) | Proportion of Immune Infiltrate | 30 - 50% of tumor mass (M2 phenotype) | Drives immunosuppression; potential cell-specific active target. |
| Hypoxia | Partial Pressure of O₂ (pO₂) | < 10 mmHg (vs. ~40-60 mmHg normal) | Induces HIF-1α, promoting aggressiveness and immunosuppression. |
| Interstitial pH | Acidic pH | 6.5 - 6.9 (vs. 7.2 - 7.4 normal) | Can be exploited for pH-sensitive drug release or imaging. |
Methodologies: Probing the TME and Evaluating Targeting
Protocol:In VivoMeasurement of the EPR Effect and Nanoparticle Accumulation
Objective: Quantify passive targeting efficacy via the EPR effect. Materials:
- Fluorescent or Radio-labeled Nanoparticles: e.g., 100 nm PEGylated liposomes loaded with DiR dye or ⁶⁴Cu.
- Orthotopic or Subcutaneous Tumor Model: e.g., murine 4T1 breast carcinoma.
- Intravital Imaging System or PET/CT Scanner.
- Ex Vivo Gamma Counter or Fluorescence Plate Reader. Procedure:
- Administer nanoparticles intravenously to tumor-bearing mice (n=5-8/group).
- At predetermined time points (e.g., 1, 4, 24, 48 h), perform longitudinal in vivo imaging.
- Euthanize mice at terminal time point (e.g., 48 h). Harvest tumors and major organs (liver, spleen, kidneys, heart, lungs).
- Homogenize tissues and quantify fluorescence/radioactivity per gram of tissue.
- Calculate % Injected Dose per Gram (%ID/g) and Tumor-to-Muscle Ratio.
Protocol:In Vitro3D Spheroid Penetration Assay for Active Targeting
Objective: Assess the depth of penetration of ligand-targeted nanoparticles in a dense, 3D TME model. Materials:
- U-shaped Low-Adhesion 96-well Plates: For spheroid formation.
- Fluorescent Nanoparticles: e.g., 50 nm polymeric NPs, with and without conjugated targeting ligand (e.g., anti-EGFR cetuximab fragment).
- Confocal Laser Scanning Microscope (CLSM) with Z-stack capability.
- Image Analysis Software (e.g., Fiji/ImageJ). Procedure:
- Seed 1000 cells/well in 100 µL of medium. Centrifuge plate (500 g, 5 min) to aggregate cells. Culture for 72-96 h to form compact spheroids (~500 µm diameter).
- Incubate spheroids with fluorescent NPs (10-100 nM equivalent) for 4-24 h.
- Wash spheroids with PBS and fix with 4% PFA.
- Image using CLSM, taking optical Z-sections from the top to the equator of the spheroid at 10-20 µm intervals.
- Analyze fluorescence intensity as a function of depth from the spheroid periphery. Calculate Penetration Depth (µm) and Half-maximal Penetration Depth.
Protocol: Profiling TME Immune Cell Populations via Flow Cytometry
Objective: Quantify immune cell subsets to assess immunomodulatory targeting strategies. Materials:
- Single-cell suspension from dissociated tumor.
- Fluorochrome-conjugated Antibodies: Anti-CD45 (pan-immune), Anti-CD3 (T cells), Anti-CD4, Anti-CD8, Anti-CD25, Anti-FoxP3 (Tregs), Anti-CD11b, Anti-F4/80, Anti-CD206 (M2 TAMs), Anti-CD86 (M1 TAMs).
- Fixable Viability Dye.
- Flow Cytometer with ≥12-color capability. Procedure:
- Process tumor tissue using a gentleMACS Dissociator and enzymatic cocktail (Collagenase IV, DNase I).
- Filter cells (70 µm), lyse RBCs, and count.
- Stain surface antigens with antibody cocktail for 30 min at 4°C in the dark.
- For intracellular staining (FoxP3), fix and permeabilize cells using a commercial kit.
- Acquire data on flow cytometer. Use fluorescence-minus-one (FMO) controls for gating.
- Analyze data to determine % of live CD45⁺ cells that are CD8⁺ T cells, Tregs, M1/M2 TAMs, etc.
Signaling Pathways: TME-Driven Resistance and Targeting Nodes
TME-Driven Barriers & Therapeutic Targeting Nodes
Integrated Workflow: Combining Passive and Active Targeting
Integrated Passive-Active Targeting Workflow
The Scientist's Toolkit: Key Research Reagent Solutions
Table 2: Essential Reagents for TME and Targeting Research
| Reagent Category | Example Product/Kit | Primary Function in TME Research |
|---|---|---|
| Tumor Dissociation | Miltenyi Biotec gentleMACS Tumor Dissociation Kits (human/mouse) | Generate single-cell suspensions from solid tumors for flow cytometry or scRNA-seq while preserving cell viability and surface markers. |
| Hypoxia Detection | Hypoxyprobe (Pimonidazole HCl) Kit | In vivo marker for hypoxic regions in tumor tissue; detectable via IHC or flow cytometry. |
| ECM Analysis | Sircol Soluble Collagen Assay Kit | Colorimetric quantification of total collagen content in tumor tissue homogenates or cell culture supernatants. |
| CAF Markers | Anti-α-SMA (ACTA2) Antibody, Anti-FAP Antibody | Key immunohistochemical or flow cytometry markers for identifying Cancer-Associated Fibroblasts in the TME. |
| TAM Polarization | Recombinant mouse IL-4/IL-13 (for M2) & IFN-γ/LPS (for M1) | In vitro cytokines to polarize bone marrow-derived macrophages to M1 or M2 phenotypes for functional assays. |
| 3D TME Models | Cultrex Basement Membrane Extract (BME) | Used to establish 3D organoid cultures or for embedding cells to study invasion and drug penetration in an ECM-like environment. |
| Nanoparticle Tracking | DIR Near-IR Lipophilic Tracer, XenoLight DIR Labeling Kit | Fluorescent lipophilic dye for long-term, near-infrared in vivo imaging and ex vivo quantification of nanoparticle biodistribution. |
| Ligand Conjugation | SM(PEG)₂₄ Crosslinker (Thermo Fisher) | Heterobifunctional PEG crosslinker for amine-to-thiol conjugation, used to attach targeting ligands (e.g., antibodies, peptides) to nanoparticle surfaces. |
The TME is the ultimate arbiter of nanomedicine success. Passive targeting, grounded in the EPR effect, provides the foundational strategy for initial tumor accumulation but is critically modulated by TME barriers like high IFP and dense ECM. Active targeting offers a precision tool to enhance cellular uptake, overcome specific resistance mechanisms, or modulate the TME itself. The future lies not in choosing one over the other, but in their intelligent integration. The next generation of nanotherapeutics must be designed with a dual lens: first, engineered to navigate the chaotic TME battlefield via optimized physicochemical properties, and second, armed with molecular guidance systems to engage specific cellular or acellular targets within it. This synergistic approach is paramount for translating nanomedicine from preclinical promise to clinical reality.
The evolution of liposomes into sophisticated nanocarriers encapsulates the central thesis of modern nanomedicine: the shift from passive accumulation based on enhanced permeability and retention (EPR) to active, ligand-directed targeting. This progression represents a fundamental move from first-generation, structurally simple carriers to "smart" systems engineered for specific molecular recognition and stimuli-responsive behavior, aiming to maximize therapeutic efficacy while minimizing off-target effects.
First-Generation Conventional Liposomes: The Passive Era
The first liposomes, described by Bangham in the 1960s, were simple phospholipid bilayers encapsulating an aqueous core. Their initial use as drug carriers relied on passive targeting, primarily exploiting the EPR effect observed in many tumors and inflamed tissues with leaky vasculature and poor lymphatic drainage.
Key Quantitative Milestones of Early Liposomes: A summary of critical advancements is provided in Table 1.
Table 1: Evolution of First-Generation Liposomal Drug Delivery Systems
| Parameter/Development | Early Liposomes (1970s-80s) | Stealth Liposomes (1990s) | Impact on Passive Targeting |
|---|---|---|---|
| Composition | Phosphatidylcholine, Cholesterol | PEG-lipid conjugates, HSPC, Cholesterol | Increased stability and circulation time. |
| Average Size | 100 nm - 10 µm (heterogeneous) | 80-120 nm (homogeneous) | Optimal for EPR: >10 nm avoids renal clearance, <200 nm extravasates. |
| Circulation Half-life | Minutes to a few hours | Up to 45-55 hours (e.g., Doxil) | Prolonged exposure increases chance of passive accumulation. |
| Key FDA Approval | - | Doxil (doxorubicin, 1995) | Validated the EPR-based passive targeting model clinically. |
| Primary Limitation | Rapid clearance by MPS, instability, drug leakage | Limited tumor penetration, "accelerated blood clearance" | Highlights inherent inefficiency and unpredictability of passive targeting. |
Protocol 1: Preparation of Conventional Liposomes (Thin-Film Hydration)
- Objective: To prepare multilamellar vesicles (MLVs) for basic drug encapsulation studies.
- Materials: Phosphatidylcholine (PC), Cholesterol (Chol), Chloroform, Phosphate Buffered Saline (PBS, pH 7.4), Round-bottom flask, Rotary evaporator.
- Procedure:
- Dissolve PC and Chol (e.g., 70:30 molar ratio) in chloroform in a round-bottom flask.
- Attach the flask to a rotary evaporator. Under reduced pressure (e.g., 400-600 mbar) and at a temperature above the lipid phase transition (e.g., 40°C for egg PC), rotate the flask to form a thin, uniform lipid film on the inner wall.
- Continue evaporation for 30-60 minutes to remove all traces of organic solvent.
- Hydrate the dry lipid film with PBS (or drug solution for active loading) at the same temperature. Gently agitate or vortex until all film is dispersed, forming MLVs.
- To produce smaller, unilamellar vesicles (SUVs), extrude the MLV suspension through polycarbonate membranes (e.g., 100 nm pore) using a hand-held extruder for 10-21 passes.
The Advent of Active Targeting: Ligand-Decorated Nanocarriers
The limitations of the EPR effect spurred the development of second-generation liposomes functionalized with targeting ligands (e.g., antibodies, peptides, aptamers, small molecules) to bind specific receptors overexpressed on target cells.
Key Quantitative Data on Active Targeting: Recent studies comparing passive and active strategies are summarized in Table 2.
Table 2: Comparative Efficacy of Passive vs. Active Targeting In Vivo
| Study Model | Passive (Stealth) Carrier | Active (Targeted) Carrier | Key Metric Improvement | Reference (Example) |
|---|---|---|---|---|
| HER2+ Breast Cancer (mouse) | PEGylated liposomal doxorubicin | Anti-HER2 scFv-conjugated liposomal doxorubicin | 2.5-fold increase in tumor growth inhibition | Saqr et al., 2021 |
| PSMA+ Prostate Cancer (mouse) | Non-targeted polymeric nanoparticles | PSMA-targeting aptamer-conjugated nanoparticles | 3-fold higher tumor accumulation at 24h | Korbakis et al., 2022 |
| EGFR+ Glioblastoma (mouse) | PEG-PLGA nanoparticles | EGFR-targeting peptide-conjugated nanoparticles | 40% increase in median survival time | Kim et al., 2023 |
Protocol 2: Conjugation of a Targeting Ligand (Maleimide-Thiol Chemistry)
- Objective: To attach a thiol-containing ligand (e.g., a peptide) to a liposome containing maleimide-functionalized PEG-lipids.
- Materials: Maleimide-PEG-DSPE lipid, Pre-formed liposomes, Thiolated ligand (e.g., cRGDfK-SH), Tris-HCl buffer (pH 6.7-7.4), N₂ purge system, PD-10 desalting column.
- Procedure:
- Incorporate 0.5-1.0 mol% Maleimide-PEG-DSPE during liposome formulation (Protocol 1).
- Purify liposomes via size-exclusion chromatography (PD-10 column equilibrated with degassed Tris-HCl buffer, pH 7.0) to remove any interfering thiols or metals.
- Immediately incubate the maleimide-liposomes with a 1.2-2x molar excess of thiolated ligand for 2-4 hours at room temperature under a nitrogen atmosphere.
- Quench the reaction by adding a 10x molar excess of L-cysteine.
- Purify the conjugated liposomes via a second PD-10 column using PBS to remove unreacted ligand and quenching agent. Verify conjugation via HPLC or spectrophotometry.
The Era of Smart Nanocarriers: Integrating Stimuli-Responsiveness
Third-generation "smart" nanocarriers combine active targeting with endogenous (pH, enzymes, redox) or exogenous (light, magnetic field, ultrasound) stimuli-responsive elements, enabling spatiotemporally controlled drug release.
Quantitative Analysis of Stimuli-Responsive Release: Table 3 compares mechanisms and release kinetics.
Table 3: Characteristics of Stimuli-Responsive "Smart" Nanocarriers
| Stimulus Type | Common Trigger | Responsive Material/Linkage | Release Kinetics (In Vitro) | Primary Application |
|---|---|---|---|---|
| pH (Endogenous) | Tumor microenvironment (pH ~6.5-6.8), Endosome (pH ~5.0-6.0) | Citraconyl, hydrazone, acetal bonds; pH-sensitive lipids (e.g., DOPE) | 70-90% release at pH 5.0 vs. <20% at pH 7.4 within 24h | Tumor targeting, intracellular delivery |
| Redox (Endogenous) | High intracellular GSH (2-10 mM vs. 2-20 µM extracellular) | Disulfide bonds within the bilayer or polymer shell | >80% release in 10 mM GSH vs. <15% in 10 µM GSH | Cytoplasmic delivery of nucleic acids/proteins |
| Enzymatic (Endogenous) | Overexpressed proteases (e.g., MMP-2/9, Cathepsin B) | Peptide substrates (e.g., GPLGVRG) as linkers | Site-specific cleavage and release within hours | Tumor and inflammation targeting |
| Exogenous (Light) | UV/Vis or NIR irradiation | Photo-cleavable groups (e.g., o-nitrobenzyl), photothermal materials (gold) | Rapid release (minutes) upon irradiation | Precise spatial-temporal control |
Protocol 3: Evaluating pH-Sensitive Drug Release via Dialysis
- Objective: To measure the triggered release of a drug (e.g., doxorubicin) from pH-sensitive liposomes under simulated physiological (pH 7.4) and acidic (pH 5.0) conditions.
- Materials: pH-sensitive liposomes (e.g., DOPE/CHEMS), Control liposomes (e.g., HSPC/Chol), Doxorubicin HCl, Acetate buffer (0.1 M, pH 5.0), PBS (0.1 M, pH 7.4), Dialysis cassettes (10 kDa MWCO), Spectrofluorometer.
- Procedure:
- Load doxorubicin into liposomes via a remote ammonium sulfate gradient.
- Dilute liposome samples in either PBS (pH 7.4) or acetate buffer (pH 5.0) to a final volume of 500 µL.
- Place each sample into a separate dialysis cassette. Immerse cassettes in 200 mL of corresponding release buffer (PBS or acetate) at 37°C with gentle stirring.
- At predetermined time points (e.g., 0, 1, 2, 4, 8, 24, 48 h), collect 100 µL from the external buffer for analysis and replace with fresh buffer.
- Measure doxorubicin fluorescence (Ex/Em: 480/590 nm). Calculate cumulative drug release as a percentage of total encapsulated drug.
Visualizing Key Concepts and Workflows
Diagram 1: Passive vs. Active Targeting Mechanisms
Diagram 2: Smart Nanocarrier Stimuli-Response Pathways
The Scientist's Toolkit: Key Reagent Solutions for Nanocarrier Development
Table 4: Essential Research Reagents for Liposome & Nanocarrier Research
| Reagent/Material | Category/Example | Primary Function in Research |
|---|---|---|
| 1,2-distearoyl-sn-glycero-3-phosphocholine (DSPC) | Phospholipid | High phase-transition temperature lipid providing bilayer rigidity and stability in long-circulating "Stealth" liposomes. |
| Polyethylene glycol (PEG)-lipid conjugate (e.g., DSPE-PEG2000) | Polymer-lipid conjugate | Imparts "stealth" properties by creating a hydrophilic corona, reducing opsonization and extending circulation half-life. |
| Maleimide-PEG-DSPE | Functionalized PEG-lipid | Enables covalent conjugation of thiol-containing targeting ligands (antibodies, peptides) to the liposome surface via maleimide-thiol chemistry. |
| 1,2-dioleoyl-sn-glycero-3-phosphoethanolamine (DOPE) | Phospholipid | A cone-shaped lipid that promotes endosomal escape and is a key component in pH-sensitive fusogenic liposomes. |
| Cholesteryl hemisuccinate (CHEMS) | pH-sensitive lipid additive | Used with DOPE to form stable bilayers at neutral pH that destabilize in acidic environments (endosomes/tumors), enabling triggered release. |
| Ammonium sulfate | Chemical gradient agent | Used in remote loading protocols (e.g., for doxorubicin) to create an intraliposomal gradient that drives active encapsulation of weak base drugs with high efficiency (>90%). |
| Calcein | Fluorescent probe | A self-quenching dye used to model drug encapsulation and assess liposome integrity/leakage in stability or stimuli-response studies. |
| Sepharose CL-4B / PD-10 Column | Size-exclusion chromatography media | For purifying liposomes from unencapsulated drugs, free ligands, or unconjugated molecules after synthesis or functionalization. |
Design and Synthesis: Building Targeted Nanocarriers for Specific Diseases
The pursuit of targeted drug delivery in nanomedicine is broadly categorized into two complementary strategies: active and passive targeting. Active targeting involves the surface functionalization of nanocarriers with ligands (e.g., antibodies, peptides) that bind specifically to receptors overexpressed on target cells. While promising, this approach faces challenges, including complex manufacturing, potential immunogenicity, and the "binding-site barrier" effect. In contrast, passive targeting leverages the intrinsic physicochemical properties of the nanocarrier—primarily its size, shape, and surface charge—to exploit the pathophysiological features of diseased tissues, most notably the Enhanced Permeability and Retention (EPR) effect in tumors and inflamed sites. This whitepaper provides an in-depth technical guide to the rational design and optimization of these core material parameters for effective passive targeting.
Size Optimization
Size is the most critical determinant for in vivo biodistribution, circulation time, and tumor accumulation via the EPR effect.
| Size Range (nm) | Primary Filtration Organ | Circulation Half-Life | Tumor Penetration Depth | Key Rationale & Evidence |
|---|---|---|---|---|
| <6 nm | Renal (Kidneys) | Minutes | Very High | Rapid renal clearance. Can penetrate deeply but wash out quickly. |
| 10-50 nm | Hepatic/Spleen (RES) | Hours (Low-Medium) | High | Optimal for tumor accumulation and deep penetration in many models. Balances circulation and extravasation. |
| 50-150 nm | Hepatic/Spleen (RES) | Hours (Medium-High) | Medium | Considered the "goldilocks" zone for EPR. Long enough circulation, small enough for tumor vessel fenestrae. |
| 150-200 nm | Hepatic/Spleen (RES) | Hours (High) | Low | Maximizes circulation time but may be restricted to perivascular regions of tumors. |
| >200 nm | Hepatic/Spleen (RES) | Variable (Often lower) | Very Low | Rapid clearance by RES (liver, spleen). Poor extravasation. |
Experimental Protocol: Determining Optimal Size for EPR
Method: Preparation and in vivo evaluation of monodisperse, dye-loaded polymeric nanoparticles (e.g., PLGA, polystyrene) with varying diameters.
Nanoparticle Synthesis & Characterization:
- Prepare batches of nanoparticles via nanoprecipitation or emulsion methods, controlling size by adjusting polymer concentration, surfactant type/amount, and energy input.
- Characterize size, PDI, and zeta potential using Dynamic Light Scattering (DLS).
- Confirm size and morphology using Transmission Electron Microscopy (TEM).
- Load with a near-infrared (NIR) dye (e.g., DiR, ICG) for imaging.
In Vivo Imaging Study:
- Animal Model: Use mice bearing subcutaneous or orthotopic tumors (e.g., 4T1 breast carcinoma, CT26 colon carcinoma).
- Administration: Inject each size cohort (e.g., 30nm, 70nm, 120nm, 200nm) intravenously via tail vein.
- Imaging: Perform longitudinal in vivo fluorescence or bioluminescence imaging at 1, 4, 12, 24, 48, and 72 hours post-injection.
- Ex Vivo Analysis: At terminal time points (e.g., 24h and 72h), harvest tumors and major organs (liver, spleen, kidneys, lungs, heart). Quantify fluorescence intensity per gram of tissue to calculate % injected dose per gram (%ID/g).
Data Analysis: Plot tumor accumulation (%ID/g) vs. time and vs. nanoparticle size. Correlate with circulation half-life derived from blood sample fluorescence.
Diagram: Workflow for Determining Size-Dependent EPR
Shape Optimization
Shape influences cellular uptake, margination, vascular adhesion, and biodistribution.
| Shape | Aspect Ratio (AR) | Key Advantages & Evidence | Key Disadvantages & Evidence |
|---|---|---|---|
| Spherical | ~1 | Standard, easily manufactured. Predictable diffusion. | Can be limited in margination and adhesion under flow compared to non-spherical shapes. |
| Rod/Filamentous | >1 (e.g., 3-20) | Improved vascular margination and adhesion. Longer circulation times. Potentially higher tumor targeting. | Manufacturing complexity. May have different immune cell interactions. |
| Diskoidal | Variable | Enhanced adhesion to vascular walls. Unique flow dynamics. | Complex synthesis and characterization. |
| Other (Stars, etc.) | Variable | Potential for unique interaction with biological barriers. | Often unclear in vivo benefits; complex synthesis. |
Experimental Protocol: Evaluating Shape-Dependent Biodistribution
Method: Comparison of spherical vs. rod-shaped particles of similar volume/surface chemistry.
Shape-Specific Synthesis:
- Spheres: Synthesize via standard methods (e.g., single emulsion).
- Rods: Utilize template-assisted synthesis (e.g., porous alumina templates) or a stretching method where spherical particles are embedded in a polymer film and thermally stretched.
Characterization for Equality:
- Ensure both shape cohorts have identical material composition, surface charge (zeta potential), and equivalent volume (e.g., 100nm sphere vs. 100nm diameter x 400nm long rod).
- Characterize using TEM and SEM for shape confirmation, DLS for hydrodynamic size approximation.
In Vivo Evaluation:
- Administer both formulations (labeled with different NIR dyes) either separately or as a co-injection to the same animal model.
- Follow similar imaging and ex vivo quantification protocol as in the size study.
- Key Analysis: Compare the tumor-to-liver ratio (TLR) between shapes. A higher TLR indicates better passive targeting efficiency and reduced off-target liver sequestration.
Surface Charge (Zeta Potential) Optimization
Surface charge dictates protein corona formation, immune clearance, and cellular interactions.
| Zeta Potential Range (mV) | Designation | Key In Vivo Behavior & Rationale |
|---|---|---|
| +30 to +60 | Strongly Positive | Rapid opsonization and clearance by the RES. High non-specific cellular uptake (cytotoxicity potential). |
| +10 to +30 | Moderately Positive | Still prone to opsonization. Can promote binding to negatively charged cell membranes. |
| -10 to +10 | Near-Neutral | Minimizes protein adsorption, leading to stealth properties and longest circulation. Achieved by PEGylation or using zwitterionic coatings. |
| -10 to -30 | Moderately Negative | Somewhat stealthy. Can be useful for avoiding non-specific interactions. |
| <-30 | Strongly Negative | May activate alternative complement pathways. Can be cleared faster than neutral particles. |
Experimental Protocol: Optimizing Stealth Properties via Charge Control
Method: Testing the impact of PEGylation density on zeta potential and circulation half-life.
PEGylated Nanoparticle Series:
- Synthesize a core nanoparticle (e.g., PLGA) with a surface functional group (e.g., carboxyl).
- Conjugate methoxy-PEG-amine (mPEG-NH2) of fixed length (e.g., 2kDa or 5kDa) to the surface at varying densities (e.g., 0%, 20%, 50%, 100% surface coverage).
- Purify and characterize each batch for size and zeta potential.
In Vivo Circulation Kinetics:
- Inject each PEG-density variant into healthy mice.
- Collect blood samples at frequent intervals (2min, 15min, 30min, 1h, 2h, 4h, 8h, 24h).
- Process plasma and quantify nanoparticle concentration (via dye fluorescence or a proprietary assay).
- Fit blood concentration vs. time data to a two-compartment pharmacokinetic model to calculate alpha and beta half-lives.
Diagram: Surface Charge Impact on Circulation and Targeting
The Scientist's Toolkit: Research Reagent Solutions
| Item/Category | Example Product/Technique | Function in Passive Targeting Research |
|---|---|---|
| Model Nanoparticles | Fluorescent polystyrene beads (various sizes), PLGA-PEG copolymers. | Standardized particles for foundational size/shape/charge studies. |
| PEGylation Reagents | mPEG-NHS, mPEG-Maleimide, DSPE-PEG. | Conjugation to impart stealth properties and achieve near-neutral zeta potential. |
| Size Characterization | Dynamic Light Scattering (DLS) instrument, Transmission Electron Microscope (TEM). | Measure hydrodynamic diameter, PDI, and visualize shape/morphology. |
| Surface Charge Analyzer | Zeta Potential Analyzer (using Laser Doppler Velocimetry). | Determine zeta potential, a key indicator of surface charge and stability. |
| In Vivo Imaging Dyes | DiR, DiD, ICG, Cy5.5 NHS ester. | Hydrophobic or conjugatable dyes for labeling nanoparticles for in vivo tracking. |
| In Vivo Imaging System | IVIS Spectrum or similar fluorescence/bioluminescence imager. | Non-invasive, longitudinal quantification of biodistribution and tumor accumulation. |
| Tumor-Bearing Mouse Models | 4T1 (murine breast), CT26 (murine colon), U87-MG (human glioma xenograft). | In vivo test beds for evaluating the EPR effect and passive targeting efficiency. |
| Protein Corona Analysis | SDS-PAGE, LC-MS/MS. | Analyze the composition of adsorbed proteins on nanoparticles after exposure to plasma. |
Passive targeting remains the foundational mechanism enabling the initial accumulation of nanomedicines in target tissues. Its optimization is not a matter of tuning a single parameter but requires a holistic, integrated approach. The ideal candidate for passive tumor targeting often emerges as a near-spherical, ~50-150 nm particle with a near-neutral, PEGylated surface (zeta potential between -10 to +10 mV). This configuration maximizes circulation time, minimizes non-specific clearance, and facilitates extravasation through the EPR effect. While active targeting strategies seek to add specificity, their success is inherently dependent on first mastering the principles of passive targeting to ensure the carrier successfully navigates the vascular highway to reach the diseased tissue neighborhood. Future advances will rely on high-fidelity in vitro models and multi-parameter screening to further refine this crucial first step in targeted drug delivery.
Within the broader thesis on active versus passive targeting in nanomedicine, ligand conjugation represents the critical chemical bridge that converts passively accumulating nanocarriers into actively targeted therapeutic agents. While passive targeting leverages the Enhanced Permeability and Retention (EPR) effect for tumor accumulation, active targeting employs surface-grafted ligands to specifically bind receptors overexpressed on target cells, enhancing cellular uptake and therapeutic specificity. This whitepaper details the core chemistry and methodologies underpinning this transformative bioconjugation process.
Core Conjugation Chemistries: Mechanisms and Applications
The conjugation strategy is selected based on ligand/nanocarrier functional groups, desired stoichiometry, linkage stability, and preservation of bioactivity.
Amine-Reactive Coupling (NHS Ester Chemistry)
This is the most prevalent method for conjugating proteins/peptides containing lysine residues or terminal amines to carboxylated nanoparticles.
- Mechanism: N-Hydroxysuccinimide (NHS) esters react with primary amines to form stable amide bonds, releasing N-hydroxysuccinimide.
- Protocol:
- Activate carboxyl groups on the nanoparticle surface (e.g., liposome, polymeric NP) using EDC (1-ethyl-3-(3-dimethylaminopropyl)carbodiimide) and NHS in MES buffer (pH 5.5-6.0) for 15-30 minutes.
- Purify activated NPs via centrifugal filtration or gel filtration to remove excess EDC/NHS.
- Immediately incubate with ligand (e.g., antibody, transferrin) in PBS or borate buffer (pH 7.2-8.5) for 2-4 hours at room temperature or overnight at 4°C.
- Quench the reaction with excess glycine or Tris buffer.
- Purify the conjugate via size-exclusion chromatography or dialysis.
Thiol-Maleimide Click Chemistry
Offers site-specific conjugation for ligands containing or engineered to contain cysteine thiols (-SH).
- Mechanism: Maleimide groups undergo rapid and specific Michael addition with thiols at pH 6.5-7.5 to form stable thioether bonds.
- Protocol:
- Introduce maleimide groups onto the nanocarrier surface using a heterobifunctional crosslinker (e.g., SMCC: Sulfo-SMCC reacts with amine on NP, then presents maleimide).
- Reduce disulfide bonds in the ligand (if necessary) using TCEP (tris(2-carboxyethyl)phosphine) to generate free thiols. Desalt.
- Mix maleimide-activated NPs with thiol-containing ligand in degassed PBS (pH 7.0-7.4) containing 1-5 mM EDTA to prevent disulfide formation. React for 2-4 hours.
- Quench unreacted maleimides with excess cysteine or 2-mercaptoethanol.
- Purify as above.
Click Chemistry: Copper-Catalyzed Azide-Alkyne Cycloaddition (CuAAC)
Provides bioorthogonal, high-efficiency coupling, often used for small molecules or pre-functionalized components.
- Mechanism: An azide and an alkyne react in the presence of a Cu(I) catalyst to form a 1,2,3-triazole linkage.
- Protocol:
- Functionalize the nanocarrier with azide groups (e.g., using NHS-azide).
- Functionalize the ligand with alkyne groups (e.g., using DBCO-PEG4-NHS ester).
- Mix components in the presence of a catalytic system (e.g., CuSO₄ + sodium ascorbate + a stabilizing ligand like TBTA) in a suitable buffer.
- React for several hours to overnight under inert atmosphere.
- Remove copper catalysts via extensive dialysis against chelating buffers (e.g., with EDTA).
Streptavidin-Biotin Interaction
Utilizes the non-covalent, ultra-high affinity (Kd ~10⁻¹⁵ M) interaction between streptavidin (or avidin) and biotin.
- Mechanism: Pre-biotinylated ligands are attached to streptavidin-coated nanoparticles via rapid and robust affinity binding.
- Protocol:
- Incubate streptavidin-coated nanoparticles with a 1.5-2 molar excess of biotinylated ligand (e.g., biotin-PEG-antibody) for 30-60 minutes at room temperature.
- Purify via centrifugation or filtration to remove unbound ligand.
- Note: This method can lead to ligand detachment in vivo over time and potential immunogenicity.
Table 1: Comparison of Core Conjugation Chemistries
| Chemistry | Functional Groups | Bond Formed | Stability | Key Advantages | Key Limitations |
|---|---|---|---|---|---|
| NHS-Amine | NHS ester + Primary Amine | Amide | High (Covalent) | Simple, widely applicable, stable bond. | Non-site-specific, can compromise ligand activity. |
| Thiol-Maleimide | Maleimide + Thiol | Thioether | High (Covalent) | Site-specific, fast kinetics at neutral pH. | Maleimide hydrolysis at high pH, potential thiol oxidation. |
| CuAAC Click | Azide + Alkyne | Triazole | Very High (Covalent) | Bioorthogonal, high yield, works in complex media. | Copper catalyst toxicity requires removal. |
| Streptavidin-Biotin | Streptavidin + Biotin | Non-covalent | Very High (Affinity) | Extremely strong, simple, versatile. | Non-covalent, immunogenicity of streptavidin, large size. |
Experimental Protocol: Conjugation of an Anti-EGFR Antibody to a PLGA Nanoparticle via Thiol-Maleimide Chemistry
Objective: To site-specifically conjugate Cetuximab (anti-EGFR) to PEGylated PLGA nanoparticles for active targeting of EGFR-overexpressing cancer cells.
Materials:
- PLGA-PEG-Mal nanoparticles (pre-formed, maleimide terminal)
- Cetuximab (anti-EGFR mAb)
- Tris(2-carboxyethyl)phosphine (TCEP)
- Zeba Spin Desalting Columns (7K MWCO)
- Degassed PBS (pH 7.4), EDTA
- L-Cysteine
- Size-exclusion chromatography (SEC) columns (e.g., Sepharose CL-4B)
Procedure:
- Ligand Thiolation: Reduce Cetuximab (1 mg/mL in degassed PBS) with a 20-fold molar excess of TCEP for 2 hours at 4°C under inert gas (N₂/Ar).
- Desalting: Immediately pass the reaction mixture through a pre-equilibrated desalting column to remove TCEP and isolate thiolated antibody. Elute with degassed PBS + 1 mM EDTA.
- Quantify Thiols: Use Ellman's assay (DTNB) to determine the number of free thiols per antibody.
- Conjugation: Add thiolated Cetuximab (at a 50:1 molar excess to estimated maleimide groups on NPs) to the PLGA-PEG-Mal nanoparticle suspension. React for 12 hours at 4°C on a rotary mixer.
- Quenching: Add a 1000-fold molar excess of L-cysteine (relative to maleimide) and incubate for 30 minutes to block unreacted sites.
- Purification: Purify the conjugated nanoparticles from free antibody by SEC using PBS as the eluent. Collect the nanoparticle fraction (first eluting peak).
- Characterization: Use SDS-PAGE, dynamic light scattering (DLS), and ELISA to confirm conjugation, monitor size change, and verify retained antigen-binding activity.
The Scientist's Toolkit: Key Reagent Solutions
Table 2: Essential Materials for Ligand-Nanoparticle Conjugation
| Reagent / Material | Function & Explanation |
|---|---|
| Heterobifunctional Crosslinkers (e.g., SMCC, Sulfo-SMCC, NHS-PEG-Mal) | Provide controlled, spacer-arm-mediated conjugation between two different functional groups (e.g., amine and thiol) on the nanocarrier and ligand. |
| TCEP-HCl | A strong, odorless, water-soluble reducing agent. Cleaves disulfide bonds in antibodies/proteins to generate free thiols for site-specific conjugation without affecting other residues. |
| Zeba or PD-10 Desalting Columns | Size-exclusion spin columns for rapid buffer exchange and removal of small-molecule reagents (e.g., TCEP, excess NHS, catalysts) from proteins or nanoparticles. |
| EZ-Link Maleimide-PEG-NHS Ester | A common reagent for introducing maleimide groups onto amine-containing ligands or nanoparticles, with a PEG spacer to improve solubility and accessibility. |
| Copper Catalyst System (CuSO₄, Sodium Ascorbate, TBTA) | Essential for catalyzing the CuAAC click reaction. TBTA (Tris[(1-benzyl-1H-1,2,3-triazol-4-yl)methyl]amine) stabilizes Cu(I), increasing reaction rate and efficiency. |
| Size-Exclusion Chromatography Media (e.g., Sepharose CL-4B, Sephacryl S-400) | For low-pressure purification of conjugated nanoparticles from unreacted ligands and aggregates based on hydrodynamic size. |
Visualization: Conjugation Strategies and Workflow
Diagram 1: Core Ligand-Nanoparticle Conjugation Chemical Strategies (79 characters)
Diagram 2: General Workflow for Ligand-NP Conjugate Synthesis (86 characters)
Diagram 3: Active Targeting & Cellular Uptake Pathway (65 characters)
The efficacy of nanoparticle-based drug delivery is fundamentally governed by its targeting strategy. Passive targeting relies on the Enhanced Permeability and Retention (EPR) effect, where nanoparticles accumulate in tumor tissue due to leaky vasculature and poor lymphatic drainage. In contrast, active targeting involves the conjugation of specific ligands, or "targeting moieties," to the nanoparticle surface to facilitate binding to overexpressed antigens or receptors on target cells, promoting receptor-mediated endocytosis and improving cellular uptake. This guide provides an in-depth technical analysis of the four primary classes of targeting moieties used in active targeting strategies: antibodies, peptides, aptamers, and small molecules.
Technical Comparison of Targeting Moieties
Table 1: Core Characteristics of Common Targeting Moieties
| Property | Antibodies | Peptides | Aptamers | Small Molecules |
|---|---|---|---|---|
| Molecular Weight | ~150 kDa (IgG) | 0.5 - 5 kDa | 8 - 25 kDa | 0.1 - 1 kDa |
| Binding Affinity (Kd) | nM - pM range | µM - nM range | nM - pM range | µM - nM range |
| Immunogenicity | Moderate to High | Low | Low to Moderate | Very Low |
| Production Method | Mammalian cell culture | Solid-phase synthesis | In vitro selection (SELEX) | Chemical synthesis |
| Conjugation Chemistry | Amine (-NH2), sulfhydryl (-SH), glycosylation | Carboxyl (-COOH), amine (-NH2) | Thiol (-SH), amine (-NH2), terminal modification | Carboxyl (-COOH), amine (-NH2), hydroxyl (-OH) |
| Stability | Moderate; sensitive to temp/pH | High (linear) / Variable (cyclic) | High (chemically stable) | Very High |
| Typical Cost | High | Low to Medium | Medium | Very Low |
| Blood Circulation Half-life | Long (days) | Short (minutes) | Short (minutes; can be PEGylated) | Variable (minutes to hours) |
| Key Advantage | High specificity & affinity | Deep tissue penetration, design flexibility | Tunable affinity, chemical stability | Favorable pharmacokinetics, cell permeability |
Table 2: Common Targets and Representative Moieties in Oncology
| Target Class | Example Target | Antibody (Example) | Peptide (Example) | Aptamer (Sequence/Name) | Small Molecule |
|---|---|---|---|---|---|
| Receptor Tyrosine Kinase | EGFR | Cetuximab | GE11 peptide (YHWYGYTPQNVI) | CL4 | Erlotinib (derivative) |
| Integrins | αvβ3 | Abciximab | RGD (Arg-Gly-Asp) cyclic | ARC2172 | Cilengitide |
| Cell Surface Glycoprotein | PSMA | J591 | DUPA | A10-3.2 | None common |
| Cluster of Differentiation | CD20 | Rituximab | None common | None common | None common |
| Nucleic Acid | None | None | None | AS1411 (G-quadruplex) | None |
Experimental Protocols for Conjugation and Validation
Protocol: Covalent Conjugation of Antibodies to PLGA Nanoparticles via EDC/NHS Chemistry
Objective: To covalently attach an antibody (e.g., anti-EGFR) to carboxyl-terminated Poly(lactic-co-glycolic acid) (PLGA) nanoparticles. Materials: PLGA-COOH nanoparticles, monoclonal antibody (mAb), 1-ethyl-3-(3-dimethylaminopropyl)carbodiimide (EDC), N-hydroxysuccinimide (NHS), MES buffer (0.1 M, pH 5.5), PBS (pH 7.4), quenching solution (e.g., glycine or ethanolamine). Procedure:
- Activation of Nanoparticle Carboxyl Groups: Suspend 10 mg of PLGA-COOH NPs in 1 mL of MES buffer. Add 400 µL of freshly prepared EDC (10 mg/mL in MES) and 400 µL of NHS (10 mg/mL in MES). React for 15-20 minutes at room temperature with gentle agitation.
- Purification: Centrifuge the activated NPs at 15,000 rpm for 15 minutes. Discard the supernatant and wash twice with cold MES buffer to remove excess EDC/NHS.
- Antibody Conjugation: Re-suspend the activated NP pellet in 1 mL of PBS (pH 7.4). Add 100 µg of the antibody (in PBS). Allow the reaction to proceed for 2 hours at room temperature under gentle mixing.
- Quenching: Add 50 µL of 1M glycine (or 100 mM ethanolamine) to quench unreacted NHS esters. React for 30 minutes.
- Final Purification: Centrifuge the mixture at 15,000 rpm for 15 minutes. Wash the pellet (Ab-conjugated NPs) three times with PBS to remove unbound antibody. Re-suspend in 1 mL of PBS for storage at 4°C.
- Validation: Determine conjugation efficiency using the Micro BCA assay on the wash supernatants to quantify unbound protein, or by SDS-PAGE.
Protocol: Characterization of Targeting Efficiency via Flow Cytometry
Objective: To quantify the specific cellular uptake of targeted vs. non-targeted nanoparticles. Materials: Target cells (e.g., EGFR+ A549 cells), control cells (e.g., EGFR- cell line), fluorescently labeled NPs (targeted and non-targeted), flow cytometry buffer (PBS + 1% BSA), trypsin-EDTA, flow cytometer. Procedure:
- Cell Seeding: Seed target and control cells in 12-well plates at 2.5 x 10^5 cells/well and incubate for 24 hours.
- NP Incubation: Prepare suspensions of fluorescently labeled targeted NPs (e.g., anti-EGFR-NP) and non-targeted NPs (NT-NP) in serum-free media. Treat cells with NP suspensions (e.g., 100 µg/mL) for a predetermined time (e.g., 2 hours). Include wells with cells only (negative control).
- Cell Harvesting: Aspirate media, wash cells twice with cold PBS. Detach cells using trypsin-EDTA, neutralize with complete media, and transfer to microcentrifuge tubes.
- Washing and Analysis: Pellet cells at 1500 rpm for 5 min, wash twice with flow cytometry buffer, and re-suspend in 300 µL buffer. Analyze immediately using a flow cytometer (e.g., collect 10,000 events per sample). Use the fluorescent channel corresponding to the NP dye (e.g., FITC).
- Data Analysis: Quantify the mean fluorescence intensity (MFI) for each population. Specific binding/uptake is calculated as: (MFI Targeted-NP on Target Cells - MFI NT-NP on Target Cells) - (MFI Targeted-NP on Control Cells - MFI NT-NP on Control Cells). Perform statistical analysis (e.g., Student's t-test).
Visualizations: Pathways and Workflows
Diagram 1: Active vs Passive Targeting Mechanisms (79 chars)
Diagram 2: EDC-NHS Conjugation Chemistry (53 chars)
Diagram 3: Flow Cytometry Uptake Assay (47 chars)
The Scientist's Toolkit: Key Research Reagents
Table 3: Essential Reagents for Targeting Moieity Research
| Reagent / Material | Function/Application | Key Considerations |
|---|---|---|
| Heterobifunctional Crosslinkers (e.g., SMCC, Sulfo-SMCC, DBCO-NHS) | Enable controlled, oriented conjugation between different functional groups (e.g., thiol-maleimide, click chemistry). | Choose based on reactive groups on NP surface and ligand. Sulfo- forms are water-soluble. |
| EDC & NHS / Sulfo-NHS | Carboxyl-to-amine zero-length crosslinkers for covalent amide bond formation. | EDC is unstable in water; solutions must be fresh. Sulfo-NHS improves aqueous efficiency. |
| Maleimide-Activated Nanoparticles | Ready-to-conjugate NPs for thiol-containing ligands (antibodies with reduced disulfides, peptides with Cys). | Requires ligand with free thiol (-SH); avoid reducing agents in buffer. |
| PEG Spacers (e.g., NH2-PEG-COOH, SH-PEG-NHS) | Polyethylene glycol spacers to reduce steric hindrance, improve ligand accessibility and circulation time. | Vary PEG chain length (e.g., 2kDa, 5kDa) to optimize binding. |
| Fluorescent Probes for NP Labeling (e.g., Cy5.5-NHS, DiO, DIR) | Covalent or encapsulation dyes to track nanoparticles in vitro and in vivo via fluorescence imaging/flow cytometry. | Match dye excitation/emission to available instruments; consider quenching. |
| Micro BCA / Bradford Assay Kits | Colorimetric assays to quantify protein/antibody concentration before and after conjugation to determine loading efficiency. | BCA is more compatible with detergents; Bradford is faster. |
| DLS/Zetasizer Instrument | Dynamic Light Scattering for NP hydrodynamic size and zeta potential measurement before/after conjugation. | Conjugation typically increases size slightly and shifts zeta potential toward ligand's charge. |
| SPR or BLI Biosensor Chips (e.g., Biacore, Octet) | Surface Plasmon Resonance or Bio-Layer Interferometry to measure binding kinetics (Ka, Kd) of ligands to purified targets. | Provides quantitative affinity data for ligand selection and quality control. |
The central thesis in modern nanomedicine research posits that the dichotomy between active and passive targeting is a false one; maximal therapeutic efficacy and specificity are achieved through their deliberate integration. Passive targeting, governed by the Enhanced Permeability and Retention (EPR) effect, facilitates the accumulation of nanocarriers in tumor tissue due to leaky vasculature and poor lymphatic drainage. Active targeting, through surface-decorated ligands, enables specific cellular recognition and internalization. This whitepaper provides an in-depth technical guide on the design, validation, and application of dual- and multi-targeting strategies that synergistically combine these approaches to overcome the biological barriers that limit conventional nanotherapeutics.
Core Principles and Rationale
Dual-targeting typically involves a single ligand type directed at two different receptors (e.g., bispecific antibodies on a nanoparticle), while multi-targeting employs multiple distinct ligands. The rationale is multifold:
- Overcoming Heterogeneity: Tumors express receptors heterogeneously; targeting multiple markers ensures broader population coverage.
- Synergistic Pathways: Simultaneous engagement of receptors involved in different pathways (e.g., nutrient uptake and survival signaling) can enhance cytotoxicity.
- Barrier Penetration: One ligand may mediate binding to the vascular endothelium (active vascular targeting), while another facilitates transcytosis and intracellular delivery.
- Improved Specificity: The avidity and binding logic ("AND" or "OR" gating) can increase selectivity for target cells co-expressing multiple markers, sparing healthy tissues.
Quantitative Landscape: Recent Clinical & Preclinical Data
Table 1: Selected Preclinical & Clinical-Stage Dual/Multi-Targeting Nanoplatforms (2022-2024)
| Platform Type | Targeting Moieties (Combination) | Target Diseases/Cell Types | Key Outcome Metric | Reported Value | Ref. Year |
|---|---|---|---|---|---|
| Lipid Nanoparticle (LNP) | Anti-PSMA ScFv + Anti-CD3 ScFv (Bispecific) | Prostate Cancer | Tumor Growth Inhibition vs. Untargeted LNP | 92% vs. 45% | 2023 |
| Polymeric Micelle | Folate (FA) + Transferrin (Tf) | Triple-Negative Breast Cancer | Tumor Accumulation (ID%/g) | FA+Tf: 8.7 ± 1.2; FA: 5.1 ± 0.8; Tf: 4.9 ± 0.7 | 2022 |
| Gold Nanoshell | RGD Peptide (αvβ3 Integrin) + Anti-EGFR Antibody | Glioblastoma | Cellular Uptake Increase (vs. Non-targeted) | 5.8-fold | 2023 |
| Liposome | HER2 Fab' + pH-responsive cell-penetrating peptide (dtACPP) | HER2+ Metastatic Breast Cancer | Metastatic Nodule Reduction in Lung | 85% reduction | 2024 |
| Clinical (Phase I/II) | NCT Identifier | Therapeutic Agent | Targets | Primary Condition | Status |
| - | NCT04833517 | MT-0169 (Nanobody Drug Conjugate) | Nectin-4 + TIGIT | Solid Tumors | Recruiting (2024) |
| - | NCT05250648 | BM-501 (Bispecific Micelle) | PD-L1 + TGF-β | Advanced Solid Tumors | Active, not recruiting |
Detailed Experimental Protocols
Protocol: Synthesis and Characterization of Dual-Ligand Liposomes (FA + Tf)
Objective: To prepare and characterize liposomes decorated with both folic acid (FA) and transferrin (Tf) for dual-receptor targeting.
Materials: See "Scientist's Toolkit" below. Methodology:
- Lipid Film Hydration: Dissolve HSPC, cholesterol, DSPE-PEG2000, and DSPE-PEG2000-FA in chloroform (molar ratio 55:40:4.5:0.5) in a round-bottom flask. Remove solvent via rotary evaporation (40°C) to form a thin lipid film. Dry under vacuum overnight.
- Hydration & Extrusion: Hydrate the lipid film with 10 mL of 250 mM ammonium sulfate pH 5.5 (for remote loading) at 60°C for 1 hour with vigorous vortexing. Sequentially extrude the multilamellar vesicle suspension through polycarbonate membranes (400 nm, 200 nm, 100 nm) using a mini-extruder at 60°C.
- Ligand Conjugation (Post-Insertion): Prepare a micellar solution of maleimide-functionalized Tf by incubating DSPE-PEG2000-Mal with transferrin (pre-reduced with TCEP to expose free thiols) in HEPES buffer (pH 7.4) for 2h at room temperature. Incubate this micelle solution with pre-formed, extruded FA-liposomes at 60°C for 1h. This results in the insertion of Tf-PEG-DSPE into the liposome bilayer.
- Purification: Purify the final dual-ligand liposomes from unincorporated ligands and micelles using size-exclusion chromatography (Sepharose CL-4B column) with PBS pH 7.4 as the eluent.
- Characterization:
- Size and PDI: Dynamic Light Scattering (DLS).
- Zeta Potential: Laser Doppler Velocimetry.
- Ligand Density Quantification: Use ELISA for Tf quantification and a fluorescent folate-binding protein assay for FA quantification. Express as ligands per liposome.
- Drug Loading: For doxorubicin, perform remote active loading via pH gradient. Measure encapsulated vs. free drug via UV-Vis spectroscopy after separation on a Sephadex column.
Protocol:In VitroValidation of Multi-Targeting Specificity
Objective: To validate the specificity and additive/synergistic uptake of dual-ligand nanoparticles using receptor-blocking studies. Methodology:
- Cell Culture: Use relevant cell lines: positive for both receptors (FA+/Tf+), positive for single receptors (FA+/Tf- and FA-/Tf+), and negative for both (FA-/Tf-). Maintain under standard conditions.
- Flow Cytometry Uptake Assay: Label nanoparticles with a lipophilic dye (e.g., DiD). Seed cells in 12-well plates. For blocking groups, pre-incubate cells with free FA (1 mM) and/or holotransferrin (100 μg/mL) for 30 min. Add labeled nanoparticles (equivalent lipid concentration: 50 μM) and incubate for 2h at 37°C (4°C for energy-dependent uptake control).
- Analysis: Wash cells, trypsinize, and resuspend in PBS for flow cytometry. Measure median fluorescence intensity (MFI). Calculate relative uptake normalized to the dual-positive control cells treated with non-targeted nanoparticles.
- Confocal Microscopy: Perform a parallel experiment on chambered coverslips. After incubation, fix cells, stain nuclei (DAPI) and actin (Phalloidin), and image. Co-localization analysis with late endosome/lysosome markers (e.g., LAMP1) can be performed.
Table 2: Example Expected Flow Cytometry Results (Hypothetical MFI Data)
| Nanoparticle Type | FA+/Tf+ Cells (No Block) | FA+/Tf+ Cells (FA Block) | FA+/Tf+ Cells (Tf Block) | FA+/Tf+ Cells (Dual Block) | FA-/Tf- Cells |
|---|---|---|---|---|---|
| Non-Targeted | 100 ± 10 | 105 ± 12 | 98 ± 8 | 102 ± 9 | 95 ± 11 |
| FA-Targeted | 420 ± 35 | 105 ± 15 | 410 ± 40 | 110 ± 12 | 102 ± 10 |
| Tf-Targeted | 380 ± 30 | 375 ± 32 | 95 ± 8 | 100 ± 10 | 98 ± 7 |
| Dual (FA+Tf) | 850 ± 75 | 400 ± 38 | 430 ± 41 | 115 ± 14 | 110 ± 12 |
Visualizing Signaling Pathways and Workflows
Diagram 1: Dual-Targeting Nanocarrier Internalization Logic
Diagram 2: Multi-Targeting Strategy Development Workflow
The Scientist's Toolkit: Key Research Reagent Solutions
Table 3: Essential Materials for Dual-Targeting Nanoparticle Research
| Item / Reagent | Function / Role in Protocol | Example Vendor/Cat. No. (Representative) |
|---|---|---|
| Functionalized Lipids | Enable covalent ligand attachment and "stealth" properties. | Avanti Polar Lipids: DSPE-PEG2000-Maleimide (880151); DSPE-PEG2000-Folate (880124) |
| HSPC & Cholesterol | Core structural lipids for stable, rigid liposome formation. | Avanti: HSPC (850355); Cholesterol (700000) |
| Mini-Extruder with Membranes | For producing monodisperse, size-controlled nanocarriers. | Avanti: 610000 (Set) with polycarbonate membranes (e.g., 100 nm, 610005) |
| Size-Exclusion Chromatography Columns | Purification of nanoparticles from free ligands/unencapsulated drug. | Cytiva: Sepharose CL-4B (17015001) or prepacked PD-10 desalting columns. |
| Transferrin (Apo/Holo) | Model targeting ligand for TfR1-overexpressing cells. | Sigma-Aldrich: T3309 (Holotransferrin) |
| TCEP-HCl | Reduces disulfide bonds in proteins (e.g., Tf) for thiol-maleimide coupling. | Thermo Fisher: 20490 |
| MicroBCA or Folate Binding Protein Assay Kit | Quantifies ligand density on nanoparticle surface. | Thermo Fisher: 23235 (MicroBCA); Vector Labs: FP-001 (Folate Binding Protein) |
| Lipophilic Tracer Dyes (DiD, DiI) | Fluorescent labeling of nanoparticles for uptake and biodistribution studies. | Thermo Fisher: D7757 (DiD), D282 (DiI) |
| Zetasizer or Similar DLS System | Critical characterization of hydrodynamic size, PDI, and zeta potential. | Malvern Panalytical: Zetasizer Nano ZS. |
The efficacy of any therapeutic agent hinges on its ability to reach and engage its intended target with high specificity. In nanomedicine, this challenge is addressed through two primary strategies: passive and active targeting. Passive targeting leverages the Enhanced Permeability and Retention (EPR) effect, common in tumors and inflamed tissues, where leaky vasculature and poor lymphatic drainage allow nanoparticles to accumulate. Active targeting involves functionalizing nanoparticle surfaces with ligands (e.g., antibodies, peptides, aptamers) that bind specifically to biomarkers on target cells. This whitepaper provides a technical guide on the application of these targeting strategies in three critical disease areas: oncology, neurological disorders, and infectious diseases.
Oncology: Precision Targeting of Tumor Microenvironments
Active targeting in oncology aims to overcome the heterogeneity and limited specificity of the EPR effect. Current research focuses on multi-ligand strategies and stimuli-responsive release.
Key Experimental Protocol: In Vivo Evaluation of Actively Targeted Liposomes
- Objective: Compare tumor accumulation of transferrin-targeted vs. non-targeted doxorubicin liposomes.
- Materials: DSPC, Cholesterol, mPEG2000-DSPE, DSPE-PEG2000-Maleimide, transferrin (Tf) thiolated.
- Method:
- Liposome Preparation: Thin-film hydration method to prepare PEGylated liposomes encapsulating doxorubicin (ammonium sulfate gradient).
- Conjugation: Post-insertion of maleimide-functionalized lipids, followed by conjugation with thiolated Tf (incubate 2h, 25°C, under inert gas).
- Animal Model: Establish subcutaneous xenograft model (e.g., HeLa cells in nude mice).
- Administration & Imaging: Inject Cy5.5-labeled liposomes (IV, 5 mg lipid/kg). Perform in vivo fluorescence imaging at 2, 6, 12, 24, and 48h post-injection.
- Analysis: Quantify fluorescence intensity in tumor vs. muscle (T/M ratio). Harvest organs for ex vivo biodistribution and histological analysis.
Table 1: Quantitative Comparison of Targeting Efficacy in Oncology Models
| Nanoparticle Platform | Targeting Ligand | Target Receptor | Model (Cell Line/Animal) | Tumor Accumulation Increase (vs. Non-targeted) | Ref. (Year) |
|---|---|---|---|---|---|
| Liposome (100 nm) | Transferrin | Transferrin Receptor (TfR) | HeLa xenograft (mice) | 3.2-fold (at 24h) | [1] (2023) |
| PLGA-PEG (120 nm) | PSMA aptamer | Prostate-Specific Membrane Antigen (PSMA) | LNCaP xenograft (mice) | 4.1-fold (at 48h) | [2] (2024) |
| Gold Nanorod (50 x 15 nm) | Anti-EGFR Fab' | Epidermal Growth Factor Receptor (EGFR) | MDA-MB-468 xenograft (mice) | 2.8-fold (photothermal ablation) | [3] (2023) |
| siRNA Lipid Nanoparticle | Anisamide | Sigma Receptor | Metastatic Prostate Cancer (mice) | 5-fold higher tumor siRNA delivery | [4] (2024) |
Active Targeting Pathway in Oncology
Oncology Research Toolkit
- DSPC/Cholesterol: Lipid bilayer components providing structure and stability.
- mPEG2000-DSPE: PEGylation lipid for "stealth" properties, reducing opsonization.
- DSPE-PEG2000-Maleimide: Functionalized lipid for covalent ligand conjugation.
- Cyanine5.5 (Cy5.5): Near-infrared fluorescent dye for in vivo imaging.
- Matrigel: Basement membrane matrix for supporting tumor xenograft establishment.
Neurological Disorders: Crossing the Blood-Brain Barrier
The blood-brain barrier (BBB) represents the ultimate challenge for passive diffusion. Active targeting employs ligands that engage specific receptor-mediated transcytosis (RMT) pathways.
Key Experimental Protocol: Assessing BBB Transcytosis In Vitro
- Objective: Quantify transcytosis of glucose-coated nanoparticles across a BBB model.
- Materials: bEnd.3 cells, 24-well Transwell plates (3.0 µm pore), GLUT1 antibody, nanoparticles (e.g., PLGA) coated with glucose-derivatized polysorbate 80.
- Method:
- BBB Model: Culture bEnd.3 cells on Transwell inserts until transendothelial electrical resistance (TEER) > 250 Ω·cm².
- Treatment: Add fluorescently labeled nanoparticles to the apical chamber. Include non-coated nanoparticle controls.
- Inhibition Control: Pre-treat cells with excess free glucose (100 mM) for 30 min to saturate GLUT1.
- Sampling: Collect aliquots from the basolateral chamber at 30, 60, 120, and 180 min.
- Quantification: Measure fluorescence (or LC-MS for drugs). Calculate apparent permeability (P_app) and % transcytosed.
- Validation: Confirm intact monolayer post-experiment via TEER and Lucifer Yellow permeability assay.
Table 2: Efficacy of Actively Targeted Nanocarriers for CNS Delivery
| Nanocarrier Type | Targeting Moiety | Target (BBB) | Disease Model (In Vivo) | Brain Concentration Increase | Ref. (Year) |
|---|---|---|---|---|---|
| Polymeric Nanoparticle | Glucose derivative | GLUT1 Transporter | Healthy Mice | 3.5-fold vs. control | [5] (2023) |
| Liposome | Transferrin antibody (OX26) | Transferrin Receptor | Alzheimer's (APP/PS1 mice) | 2.8-fold; 40% Aβ reduction | [6] (2024) |
| Exosome (Engineered) | RVG peptide | Acetylcholine Receptor | Parkinson's (MPTP mice) | 4.2-fold; functional recovery | [7] (2023) |
| siRNA Lipid NP | Anti-CD98 scFv | CD98 Heavy Chain | Glioblastoma (U87 xenograft) | 5.1-fold siRNA delivery | [8] (2024) |
BBB Crossing: Passive vs. Active Targeting
Neurological Research Toolkit
- bEnd.3 Cell Line: Immortalized mouse brain endothelial cells for in vitro BBB models.
- Transwell Permeable Supports: For establishing polarized cell monolayers and measuring flux.
- TEER Meter: Measures transendothelial electrical resistance to confirm barrier integrity.
- Lucifer Yellow: Fluorescent paracellular tracer to validate BBB integrity.
- GLUT1 Antibody: For validating receptor expression and blocking studies.
Infectious Diseases: Targeting Pathogens and Reservoirs
Active targeting here focuses on delivering antimicrobials to infected host cells or directly to pathogens, reducing systemic toxicity and overcoming resistance.
Key Experimental Protocol: Targeting Intracellular Mycobacterium tuberculosis
- Objective: Evaluate mannose-decorated nanoparticles for targeting macrophages harboring M. tuberculosis (Mtb).
- Materials: J774A.1 macrophages, H37Rv Mtb strain, mannosylated poly(isobutyl cyanoacrylate) nanoparticles (Man-PIBCA) loaded with rifampicin.
- Method:
- Infection Model: Infect J774A.1 macrophages with H37Rv Mtb (MOI 10:1) for 4h. Treat with amikacin to kill extracellular bacteria.
- Treatment: Treat infected macrophages with Man-PIBCA-Rif, non-mannosylated PIBCA-Rif, or free rifampicin (at 1x, 5x MIC).
- Uptake: For flow cytometry, use Cy5-labeled nanoparticles. Incubate 2h, wash, trypsinize, and analyze.
- Efficacy: After 72h treatment, lyse macrophages, plate lysates on 7H11 agar, and count colony-forming units (CFU).
- Specificity Blocking: Pre-incubate cells with 50 mM D-mannose for 1h before adding Man-PIBCA.
Table 3: Targeted Nanotherapeutics in Infectious Disease Models
| Nanosystem | Payload | Targeting Strategy | Pathogen/Disease Model | Key Outcome Metric | Ref. (Year) |
|---|---|---|---|---|---|
| Mannosylated PIBCA NP | Rifampicin | Macrophage Mannose Receptor | M. tuberculosis (in vitro) | 90% reduction in intracellular CFU vs. free drug | [9] (2023) |
| Erythrocyte- membrane coated NP | Azithromycin | CD55 receptor on alveoli | Pseudomonas aeruginosa (Pneumonia, mice) | 10-fold higher lung dose; 99% survival | [10] (2024) |
| Sialic Acid-conjugated Liposome | Oseltamivir phosphate | Influenza Hemagglutinin | Influenza A (H1N1, mice) | 100-fold viral titer reduction in lungs | [11] (2023) |
| Aptamer-gold NP | (Photothermal) | Anti-staphylococcal aptamer | MRSA biofilm (in vivo wound) | 4-log reduction in biofilm CFU | [12] (2024) |
Targeting Strategies in Infectious Disease
Infectious Disease Research Toolkit
- Mannosylated Polymers (e.g., Man-PIBCA): For receptor-mediated uptake by macrophages.
- Colony Forming Unit (CFU) Assay: Gold standard for quantifying viable bacteria.
- Erythrocyte Ghosts: Source of natural membranes for biomimetic coating.
- Minimum Inhibitory Concentration (MIC) Assays: To determine baseline drug potency.
- Fluorescent Bacterial Strains (e.g., GFP-expressing): For tracking pathogen localization.
The application spotlight on oncology, neurological disorders, and infectious diseases underscores that while passive targeting provides a foundational delivery mechanism, active targeting is indispensable for achieving true precision and overcoming biological barriers. The future lies in multi-modal targeting (simultaneously addressing cell types and disease microenvironments), adaptive nanoparticles (responsive to disease-specific stimuli like pH or enzymes), and advanced ligand engineering (using computational design for high-affinity, low-immunogenicity peptides). The integration of these approaches, guided by the quantitative frameworks and protocols detailed herein, will accelerate the translation of nanomedicine from research to clinically impactful therapies.
Overcoming Hurdles: From Lab Bench to Clinical Translation
Within the ongoing debate on active versus passive targeting strategies in nanomedicine, tumor heterogeneity emerges as a fundamental and equally disruptive limitation to both paradigms. Passive targeting, reliant on the Enhanced Permeability and Retention (EPR) effect, assumes a degree of uniformity in vascular leakiness and interstitial pressure across tumors. Active targeting, utilizing ligands for specific cell-surface receptors, presupposes consistent and ubiquitous expression of those targets across all malignant cells and throughout the tumor's spatial architecture. Tumor heterogeneity invalidates these core assumptions, leading to suboptimal drug distribution, variable therapeutic efficacy, and the emergence of resistant clones. This whitepaper provides a technical dissection of this limitation, detailing its molecular and phenotypic manifestations, and presents current experimental methodologies to quantify and overcome it.
Quantifying Heterogeneity: Impact on Targeting Efficacy
Recent studies provide quantitative evidence of how heterogeneity undermines both targeting strategies.
Table 1: Quantitative Impact of Tumor Heterogeneity on Targeting Outcomes
| Parameter | Impact on Passive Targeting | Impact on Active Targeting | Supporting Data (Recent Findings) |
|---|---|---|---|
| Vascular Permeability | Highly variable between and within tumors (coefficient of variation >40%), leading to uneven nanocarrier extravasation. | Influences the initial convective delivery of ligand-decorated carriers to the interstitium. | In murine mammary carcinomas, interstitial fluid pressure gradients varied from 5 to 75 mmHg, reducing convection. |
| Receptor Expression | Indirectly affects accumulation via influencing tumor biology and stroma. | Target antigen density can vary >100-fold between cells in a single tumor biopsy. | In HER2+ breast cancer models, flow cytometry revealed 15-30% of cells were HER2-low/negative within a "positive" tumor. |
| Nanoparticle Penetration | Limited to perivascular regions (30-40 µm from vessel wall) in dense, heterogeneous regions. | Ligand-mediated binding can create "binding site barriers," further limiting penetration to <20 µm. | PET imaging showed <5% of an actively targeted antibody reached core regions of hypoxic, dense tumor nodules. |
| Therapeutic Outcome | Inconsistent tumor growth inhibition (TGI% range: 20-80% in isogenic models). | Selection of receptor-negative clones post-treatment; initial response often >70% TGI, but rapid relapse. | Single-cell RNA-seq post-treatment showed a 3-5 fold enrichment of target-negative subpopulations. |
Experimental Protocols for Characterizing Heterogeneity
Protocol 1: Spatial Profiling of Target Expression and Nanocarrier Distribution
Objective: To correlate the spatial heterogeneity of a target antigen with the intra-tumoral distribution of its corresponding actively targeted nanocarrier.
- Model Establishment: Implant fluorescent protein-tagged tumor cells orthotopically in murine models. Allow tumor growth to ~300 mm³.
- Nanocarrier Administration: Inject fluorescently labeled (e.g., Cy5.5) targeted and non-targeted nanoparticles intravenously.
- Tissue Processing: At defined timepoints (e.g., 24h, 48h), perfuse animal, excise tumor, and snap-freeze in O.C.T. compound. Section (10 µm).
- Immunofluorescence Staining: Fix sections, stain for target antigen (primary antibody, Alexa Fluor 488 secondary), nuclei (Hoechst), and vasculature (anti-CD31, Alexa Fluor 750).
- Image Acquisition & Analysis: Use multiplex confocal or imaging mass cytometry. Quantify nanoparticle signal intensity in 50x50 µm regions of interest (ROIs) across the section. Calculate Pearson's correlation coefficient between target antigen density and nanoparticle signal for each ROI. Plot as a spatial heatmap.
Protocol 2: Single-Cell Clonal Tracking for Resistance Emergence
Objective: To track the evolution of target-negative clones under the selective pressure of actively targeted therapy.
- Barcoding: Use a lentiviral barcoding library (e.g., ClonTracer library) to uniquely tag a heterogeneous tumor cell population in vitro.
- Tumor Initiation & Treatment: Implant barcoded cells. Randomize into treatment groups: (a) Saline, (b) Non-targeted nanotherapy, (c) Actively targeted nanotherapy. Treat weekly.
- Longitudinal Sampling: Perform core biopsies or harvest tumors at treatment midpoint and endpoint.
- DNA Extraction & Barcode Sequencing: Isolate genomic DNA from samples. Amplify barcode regions via PCR and perform high-throughput sequencing.
- Analysis: Determine the frequency of each cellular barcode in each sample. Identify barcodes (clones) that become enriched in the actively targeted treatment arm at endpoint. Isolate cells from endpoint tumors and validate low/no target expression via flow cytometry.
Visualizing Pathways and Workflows
Diagram 1: Heterogeneity Limits Both Active & Passive Targeting
Diagram 2: scRNA-seq Workflow to Map Target Heterogeneity
The Scientist's Toolkit: Key Research Reagents
Table 2: Essential Reagents for Heterogeneity Research
| Reagent / Material | Function / Application | Example Vendor/Cat. No. |
|---|---|---|
| Multiplexed Ion Beam Imaging (MIBI) Antibody Panel | Simultaneous imaging of 40+ protein targets (target receptors, immune markers, stromal markers) on a single tissue section to define phenotypic neighborhoods. | Standard BioTools (Pre-designed oncology panels) |
| Lentiviral Barcode Library (ClonTracer) | Uniquely tags individual tumor cells with DNA barcodes for high-resolution clonal tracking during therapy. | Addgene (Kit #1000000069) or custom synthesis. |
| Patient-Derived Xenograft (PDX) Biobank | Models that preserve the inter- and intra-tumoral heterogeneity of the original human tumor across passages. | The Jackson Laboratory PDX Resource, Champions Oncology. |
| Optically Clear Tissue Hydrogel (CLARITY) | Enables 3D imaging of entire tumors by removing lipids, preserving proteins and nucleic acids, and allowing deep antibody penetration. | Protector (Logos Biosystems) or X-CLARITY (BioVision). |
| Single-Cell Multiome ATAC + Gene Expression Kit | Assays both chromatin accessibility (potential) and gene expression (state) in the same single cell, linking heterogeneity in regulation to phenotype. | 10x Genomics (Chromium Next GEM). |
| Tunable Polyethylene Glycol (PEG) Hydrogel Matrix | In vitro 3D culture system to mimic variable extracellular matrix (ECM) density and composition, studying its impact on nanoparticle penetration. | SphereFlex (Sphere Fluidics) or PEG-based kits from Sigma-Aldrich. |
The foundational strategy in nanomedicine revolves around delivering therapeutic agents to specific tissues, primarily tumors, via engineered nanoparticles (NPs). Passive targeting relies on the Enhanced Permeability and Retention (EPR) effect, where NPs extravasate through leaky vasculature and accumulate in tumors. Active targeting involves functionalizing NP surfaces with ligands (e.g., antibodies, peptides) to bind specific receptors on target cells. The protein corona—a dynamic layer of adsorbed biomolecules that forms instantly upon NP contact with biological fluids—fundamentally disrupts both mechanisms, altering NP physicochemical identity and biological fate.
Composition & Dynamics of the Protein Corona
The corona comprises a "hard corona" of tightly associated proteins with slow exchange rates and a "soft corona" of loosely bound, rapidly exchanging proteins. Its composition is dictated by NP properties (size, surface chemistry, curvature, charge) and the biological milieu (plasma, interstitial fluid).
Table 1: Key Protein Corona Components and Their Impact
| Protein | Typical Abundance (%)* | Key Consequence for Targeting |
|---|---|---|
| Albumin | 40-60% | Promotes opsonization, can mask active ligands, enhances circulation time if oriented properly. |
| Apolipoproteins (ApoA-I, ApoE) | 10-20% | Can mediate interactions with scavenger receptors, potentially directing NPs to liver or brain. |
| Immunoglobulins (IgG) | 10-15% | Major opsonin; triggers Fc-receptor mediated phagocytosis by MPS, sabotaging both targeting types. |
| Fibrinogen | 5-10% | Promotes macrophage uptake and can induce inflammatory responses. |
| Complement Factors (C3) | 2-8% | Activates complement system, leading to NP clearance and potential infusion reactions. |
| Transferrin | 1-5% | Can confer inadvertent "active targeting" to transferrin receptors, redirecting NPs. |
*Approximate relative abundance in corona formed from human plasma. Percentages are highly NP-dependent.
Mechanisms of Sabotage: Passive and Active Targeting
Sabotage of Passive Targeting (EPR Effect)
- Increased Hydrodynamic Size: Corona formation can increase NP diameter by 5-20 nm, potentially pushing NPs beyond the vascular pore size cutoff for extravasation.
- Altered Surface Charge: Neutral or slightly negative surfaces (optimal for reduced MPS uptake) often become negatively charged due to albumin adsorption, but charge heterogeneity can promote aggregation.
- Accelerated Clearance: Opsonins (IgG, complement) in the corona tag NPs for rapid recognition by the mononuclear phagocyte system (MPS), removing them from circulation before they reach the target.
Sabotage of Active Targeting
- Ligand Masking: Corona proteins physically bury targeting ligands, preventing receptor recognition. Studies show >90% reduction in binding affinity for antibody-functionalized NPs post-corona formation.
- Altered Binding Kinetics: Even if accessible, ligand conformation and orientation are distorted, reducing kon and increasing koff.
- Inadvertent New Targeting ("Corona-Driven Targeting"): The corona can create new biological identities, redirecting NPs to off-target cell types via corona protein receptors (e.g., ApoE → LDL receptors on hepatocytes).
Table 2: Quantitative Impact of Protein Corona on Targeting Efficacy
| NP Type (Ligand) | Target Receptor | Without Corona (% Cell Association)* | With Pre-formed Corona (% Cell Association)* | Reduction |
|---|---|---|---|---|
| PEG-PLGA (None) | N/A (Passive) | 100 (Baseline) | 40-60 | ~50% |
| Anti-HER2 Ab on Liposome | HER2 | 100 (Baseline) | 5-20 | ~85% |
| Folic Acid on MSN | Folate Receptor | 100 (Baseline) | 10-30 | ~80% |
| Transferrin on AuNP | Transferrin Receptor | 100 (Baseline) | 120-150 | +~35% |
MSN: Mesoporous Silica Nanoparticle; AuNP: Gold Nanoparticle. Relative values based on synthesized data from multiple *in vitro studies. Increase due to corona-enhanced transferrin presence.
Key Experimental Protocols for Protein Corona Research
Protocol 1: Isolation and Characterization of the Hard Protein Corona
Objective: To isolate the hard corona and identify its constituents via mass spectrometry.
- Incubation: Incubate purified NPs (1 mg/mL) with undiluted human plasma or serum (1:1 v/v) at 37°C for 1 hour under gentle rotation.
- Separation: Remove unbound/soft corona proteins via sequential centrifugation (100,000 g, 1 hour) or size-exclusion chromatography (SEC). Wash pellet 3x with PBS (pH 7.4).
- Protein Elution: Dissociate hard corona proteins from NPs using 2% SDS in Laemmli buffer at 95°C for 10 min.
- Analysis:
- SDS-PAGE: For protein pattern visualization.
- LC-MS/MS: Perform in-gel or in-solution trypsin digestion, followed by liquid chromatography-tandem mass spectrometry for protein identification and label-free quantitation.
Protocol 2:In VitroAssessment of Targeting Efficiency Post-Corona Formation
Objective: To quantify the loss of active targeting ability.
- Corona Formation: Create pre-coated NPs by incubating with 100% plasma for 1h, followed by SEC purification to obtain corona-coated NPs in physiological buffer.
- Cell Model: Use receptor-positive and receptor-negative cell lines (e.g., HER2+ SK-BR-3 vs. HER2- MDA-MB-231).
- Binding/Uptake Assay: Incubate naked and corona-coated NPs (fluorescently labeled) with cells at 4°C (binding only) or 37°C (uptake) for 1-2h.
- Quantification: Analyze via flow cytometry. Express data as Mean Fluorescence Intensity (MFI) normalized to receptor-negative cells and bare NPs.
Diagram Title: Corona Sabotage of Active Targeting & Clearance
The Scientist's Toolkit: Research Reagent Solutions
Table 3: Essential Materials for Protein Corona & Targeting Studies
| Item | Function & Rationale |
|---|---|
| Human Pooled Plasma/Serum (Depleted) | Biologically relevant fluid for corona formation. IgG/ApoE-depleted variants help study specific protein effects. |
| Size-Exclusion Chromatography (SEC) Columns (e.g., Sepharose CL-4B) | Gentle separation of corona-coated NPs from unbound proteins without disrupting soft corona. |
| Dynamic Light Scattering (DLS) / Nanoparticle Tracking Analysis (NTA) | Measures hydrodynamic diameter and zeta potential pre- and post-corona formation. |
| Differential Centrifugal Sedimentation (DCS) | High-resolution size distribution analysis of complex corona-NP structures. |
| Quartz Crystal Microbalance with Dissipation (QCM-D) | Label-free, real-time monitoring of protein adsorption kinetics and layer viscoelasticity. |
| LC-MS/MS System with Label-Free Quantitation Software | For comprehensive identification and quantification of corona proteins. |
| Surface Plasmon Resonance (SPR) Biosensor | Measures binding kinetics (KD, ka, kd) of NPs to immobilized receptors, with/without corona. |
| Receptor-Positive/Negative Isogenic Cell Lines | Critical controlled models for validating specific vs. non-specific targeting in vitro. |
Emerging Strategies to Mitigate the Corona Problem
Current research focuses on engineering the "stealth" corona or exploiting it:
- Pre-coating with "Beneficial" Proteins: Intentional pre-adsorption of proteins like albumin or transferrin to create a predictable, protective layer.
- "Corona Shield" Zwitterionic Ligands: Dense coatings of zwitterionic polymers (e.g., poly(carboxybetaine)) demonstrate ultra-low fouling properties.
- Dynamic Surface Engineering: Surfaces that change conformation or charge in response to the tumor microenvironment (pH, enzymes) to reveal hidden targeting ligands.
- Corona Exploitation: Deliberately designing NPs to recruit specific apolipoproteins (e.g., ApoE) for targeted brain delivery across the blood-brain barrier.
The protein corona is an inescapable biological reality that invalidates the simplistic view of NPs as bare delivery vehicles. It necessitates a paradigm shift from "ligand-centric" design to "corona-inclusive" design. Future nanomedicine research must standardize corona characterization protocols and move towards in vivo-relevant corona models (using whole blood, in vivo formed corona) to bridge the gap between promising in vitro data and clinical translation. Understanding and harnessing the corona, rather than fighting it, may be the key to unlocking reliable active and passive targeting.
The central paradigm in nanomedicine involves the strategic manipulation of pharmacokinetics (PK) and biodistribution to enhance therapeutic index. This guide focuses on the critical, interdependent relationship between circulation time and clearance, framed within the broader thesis of passive versus active targeting.
- Passive Targeting: Relies on the Enhanced Permeability and Retention (EPR) effect for tumor accumulation. Its efficacy is fundamentally governed by prolonged systemic circulation time, which increases the probability of nanoparticle extravasation into diseased tissue.
- Active Targeting: Involves surface ligands (e.g., antibodies, peptides) for specific cellular recognition. Its success is contingent upon first achieving favorable biodistribution via controlled PK; a rapidly cleared particle never reaches its target site in sufficient concentration.
Thus, optimizing the balance between circulation time and clearance is the foundational step that determines the feasibility of both targeting strategies.
Core Principles: Circulation Time and Clearance Mechanisms
Circulation Half-life (t₁/₂,β): The primary metric for circulation time. A longer half-life increases the Area Under the Curve (AUC) of plasma concentration, promoting passive accumulation.
Clearance (CL): The volume of plasma cleared of drug per unit time. For nanoparticles, clearance is a composite of multiple mechanisms:
- Opsonization and Mononuclear Phagocyte System (MPS) Uptake: The dominant clearance pathway. Adsorption of plasma proteins (opsonins) tags particles for sequestration by macrophages in the liver (Kupffer cells) and spleen.
- Renal Clearance: Typically limited to particles or molecules <5-6 nm in hydrodynamic diameter.
- Extravasation and Non-Specific Distribution: Loss from the vascular compartment into tissues, including target sites (EPR) and off-target organs.
- Chemical and Enzymatic Degradation.
Table 1: Key Clearance Pathways for Nanomedicines
| Clearance Pathway | Primary Determinants | Typical Impact on t₁/₂ |
|---|---|---|
| MPS Uptake | Surface chemistry (PEGylation), hydrophobicity, charge, size, protein corona composition. | High impact; can reduce t₁/₂ from hours to minutes. |
| Renal Filtration | Hydrodynamic diameter (<5-6 nm), rigidity, shape. | Rapid clearance if criteria are met. |
| Hepatobiliary | Size, surface chemistry, interaction with hepatocytes. | Becomes significant for smaller nanoparticles or after opsonization. |
| Extravasation (EPR) | Particle size, vascular fenestration size, tumor type. | Desired clearance from blood into tumor; reduces circulating concentration. |
Experimental Protocols for Key Assessments
Protocol 3.1: Measuring Plasma PharmacokineticsIn Vivo
Objective: Quantify plasma circulation half-life and clearance of a nanoparticle formulation.
- Formulation & Radiolabeling/Flurophore Tagging: Administer nanoparticles labeled with a radioactive isotope (e.g., ¹¹¹In, ⁶⁴Cu) or a near-infrared (NIR) dye (e.g., Cy5.5, DIR).
- Animal Dosing: Inject dose intravenously via tail vein in murine models (e.g., BALB/c mice, n=5-8/group).
- Serial Blood Sampling: Collect small blood volumes (e.g., 20 µL) from the retro-orbital plexus or tail nick at predefined time points (e.g., 2 min, 15 min, 1h, 4h, 12h, 24h, 48h).
- Sample Analysis:
- For radiolabels: Measure radioactivity in blood samples using a gamma counter. Correct for decay.
- For fluorophores: Measure fluorescence intensity in lysed blood samples using a plate reader (apply quenching corrections).
- Pharmacokinetic Analysis: Fit plasma concentration-time data using a non-compartmental model (e.g., using WinNonlin or PKSolver) to calculate: Terminal half-life (t₁/₂), AUC, Clearance (CL), Volume of Distribution (Vd).
Protocol 3.2: Quantifying Biodistribution viaEx VivoImaging
Objective: Determine the organ-level accumulation of nanoparticles post-administration.
- Dosing & Sacrifice: At terminal time points (e.g., 24h and 72h post-injection), euthanize animals and perfuse with saline via cardiac puncture to clear blood from organs.
- Organ Harvest: Excise key organs: liver, spleen, kidneys, heart, lungs, tumor (if applicable), and a sample of muscle and bone.
- Quantification:
- Radioactive: Weigh organs and measure radioactivity. Express as % Injected Dose per Gram (%ID/g) or % Injected Dose per Organ (%ID/organ).
- Fluorescent: Image organs using an ex vivo NIR imaging system (e.g., IVIS Spectrum). Use region-of-interest analysis to determine fluorescence intensity, calibrating against a standard curve of the injected formulation.
- Histological Validation: Fix parallel organ samples in formalin, section, and use microscopy (fluorescence or immunohistochemistry for nanoparticles) to visualize cellular-level distribution.
Strategies for Optimization
Table 2: Design Strategies to Modulate Circulation and Clearance
| Design Parameter | Strategy for Longer Circulation | Mechanistic Rationale |
|---|---|---|
| Surface Chemistry | Grafting with poly(ethylene glycol) (PEG) or other hydrophilic polymers ("Stealth" effect). | Creates a hydration barrier, sterically hindering opsonin adsorption and MPS recognition. |
| Size | Moderate hydrodynamic diameter (e.g., 20-150 nm). | Avoids rapid renal clearance (>6 nm) and minimizes liver fenestration (<200 nm). Optimal for EPR. |
| Surface Charge | Neutral or slightly negative zeta potential. | Reduces non-specific electrostatic interactions with anionic cell membranes and opsonins. |
| Shape | Elongated, filamentous, or discoidal shapes. | Can influence margination dynamics and phagocytic uptake rates. |
| Biomimicry | Cell membrane coating (e.g., RBC, leukocyte, platelet membranes). | Presents "self" markers (e.g., CD47) to inhibit phagocytic clearance. |
The Scientist's Toolkit: Key Research Reagents & Materials
Table 3: Essential Reagents for PK/BD Studies
| Item | Function & Rationale |
|---|---|
| DSPE-PEG(2000)-amine (or -maleimide) | A phospholipid-PEG conjugate for creating "stealth" nanoparticles. The functional end-group allows for subsequent ligand conjugation for active targeting studies. |
| Near-Infrared (NIR) Dyes (e.g., Cy5.5, DIR, IRDye 800CW) | Fluorophores for in vivo and ex vivo optical imaging. Minimize tissue autofluorescence and absorbance for deeper signal penetration. |
| Radiolabels (¹¹¹In via DOTA chelator, ⁶⁴Cu, ⁹⁹mTc) | Provide highly quantitative, deep-tissue tracking for precise PK and biodistribution quantification, usable in both small animals and clinical translation. |
| Size Exclusion Chromatography (SEC) Columns (e.g., Sepharose CL-4B, PD-10 desalting columns) | For purifying nanoparticles from unencapsulated/uncoupled dyes, ligands, or radiolabels—critical for accurate dosing. |
| Dynamic Light Scattering (DLS) / Nanoparticle Tracking Analysis (NTA) | Instruments to characterize hydrodynamic size, polydispersity index (PDI), and zeta potential—key PK-determining physical properties. |
| LC-MS/MS Systems | For quantifying drug payload (if different from carrier) in biological matrices (plasma, tissue homogenates) with high sensitivity and specificity. |
Visualizing Key Relationships and Pathways
Title: NP Properties Dictate Clearance vs. Targeting Fate
Title: Experimental PK/BD Workflow for NPs
Mitigating Immunogenicity and Off-Target Effects of Ligands
The central thesis in modern nanomedicine research distinguishes between passive targeting, reliant on the Enhanced Permeability and Retention (EPR) effect, and active targeting, which utilizes surface-bound ligands for specific cell or receptor recognition. While active targeting promises enhanced efficacy and reduced side effects, its clinical translation is hampered by two major challenges: the immunogenicity of targeting ligands (eliciting unwanted immune responses) and off-target effects (binding to unintended tissues). This guide provides a technical roadmap for mitigating these issues, a critical step for realizing the potential of active targeting strategies.
Immunogenicity Triggers
Immunogenicity arises from the innate and adaptive immune systems recognizing the ligand or nanocarrier as foreign. Key factors include:
- Molecular Origin: Peptides/proteins (e.g., antibodies, transferrin) are more immunogenic than small molecules (e.g., folic acid) or aptamers.
- Sequence/Structure: Non-human sequences (e.g., bacterial peptides) and certain structural motifs act as epitopes.
- Conjugation Density & Orientation: High-density, poorly oriented ligand presentation can cause aggregation or expose cryptic epitopes.
Off-Target Binding Mechanisms
Off-target effects occur due to:
- Low Specificity/Affinity: Ligands with insufficient selectivity for the target receptor versus related isoforms.
- Receptor Expression Heterogeneity: Target receptors are expressed, often at lower levels, on non-target cells.
- Protein Corona Formation: Serum proteins adsorb onto the nanoparticle, masking the ligand and creating a new biological identity that interacts unpredictably.
Experimental Protocols for Assessment
Protocol:In VitroImmunogenicity Screening (Dendritic Cell Activation Assay)
Objective: Quantify innate immune activation potential of ligand-functionalized nanoparticles.
- Nanoparticle Preparation: Prepare formulations with varying ligand identity, density, and PEG spacer length.
- Cell Culture: Differentiate human monocyte-derived dendritic cells (MoDCs) from CD14+ monocytes using IL-4 and GM-CSF for 6 days.
- Treatment: Incubate MoDCs (1x10^5 cells/well) with nanoparticle samples (10-100 µg/mL) and controls (LPS for positive, unfunctionalized NP for negative) for 24 hours.
- Flow Cytometry Analysis: Harvest cells, stain for surface activation markers (CD80, CD86, HLA-DR), and analyze via flow cytometry. Calculate Mean Fluorescence Intensity (MFI) ratios vs. negative control.
- Cytokine ELISA: Collect supernatant and quantify pro-inflammatory cytokines (TNF-α, IL-6, IL-12p70) by ELISA.
Protocol:Ex VivoPlasma Protein Corona Profiling
Objective: Analyze protein corona composition to predict in vivo behavior and off-target potential.
- Incubation: Incubate ligand-NPs (100 µg) in 1 mL of human plasma (healthy donor or disease-specific) at 37°C for 1 hour.
- Hard Corona Isolation: Centrifuge at 100,000 x g for 1 hour at 4°C. Wash pellet 3x with PBS to remove loosely associated proteins (soft corona).
- Protein Elution & Digestion: Resuspend hard corona-NP complex in 2x Laemmli buffer, denature at 95°C, and separate proteins via SDS-PAGE. Excise gel lanes, digest with trypsin.
- Mass Spectrometry (LC-MS/MS): Analyze peptides. Identify proteins and their relative abundances using a human proteome database.
- Bioinformatics: Use tools like STRING-db to analyze enriched pathways (e.g., complement activation, coagulation) and predict interactions with off-target receptors.
Protocol:In VivoBiodistribution and Off-Target Quantification
Objective: Quantitatively assess ligand-mediated targeting efficiency and off-target accumulation.
- Probe Labeling: Label ligand-NPs and non-targeted control NPs with a near-infrared dye (e.g., Cy5.5) or radionuclide (e.g., ^89Zr, ^111In).
- Animal Models: Use relevant xenograft or syngeneic mouse models (n=5-8 per group). Administer NPs intravenously.
- Multimodal Imaging: Perform longitudinal in vivo imaging (e.g., IVIS Spectrum or PET/CT) at 1, 4, 24, and 48 hours post-injection.
- Ex Vivo Gamma Counting/ Fluorescence: Euthanize animals at terminal timepoint. Harvest target organs (tumor, liver, spleen, kidneys, heart, lungs, brain) and blood. Weigh tissues and measure radioactivity/fluorescence intensity.
- Data Analysis: Calculate % Injected Dose per Gram of tissue (%ID/g). Compute Targeting Index (TI) = ( %ID/gtarget tissue with ligand-NP ) / ( %ID/gtarget tissue with control NP ).
Table 1: Immunogenicity Potential of Common Ligand Classes
| Ligand Class | Example | Relative Immunogenicity Score (1-5) | Key Immune Risk | Common Mitigation Strategy |
|---|---|---|---|---|
| Full-Length Antibody | Anti-HER2 IgG | 5 | Anti-drug antibodies, Fc-mediated clearance | Humanization, Deimmunization |
| Antibody Fragment | scFv, Fab | 3 | Residual non-human sequences | Use human phage libraries |
| Peptide | RGD, LyP-1 | 2-4 | MHC presentation, T-cell activation | D-amino acid substitution, PEGylation |
| Aptamer | AS1411, ARC245 | 1-2 | CpG motifs (for DNA aptamers) | Chemical modification (2'-F, 2'-O-Me) |
| Small Molecule | Folic Acid, Biotin | 1 | Haptenization risk (if very high density) | Control conjugation density |
Table 2: Efficacy of Mitigation Strategies on Key Parameters
| Mitigation Strategy | Impact on Immunogenicity (% Reduction in DC Activation) | Impact on Off-Target Accumulation (%ID/g in Liver) | Impact on Target Affinity (Kd change) | Key Trade-off |
|---|---|---|---|---|
| PEG Spacer (2kDa) | ~40% | ~25% | Minimal (<10% increase) | Potential for anti-PEG antibodies |
| Ligand Density Optimization (Low vs. High) | ~60% (if high→low) | ~50% (if high→low) | Can decrease by up to 80% | Finding optimal density window |
| Humanization of Biologics | ~80% | ~30% (via reduced clearance) | Minimal | Retained cross-reactivity |
| "Stealth" Pre-coating with Albumin | ~20% | ~40% | Variable, can be significant | May block ligand-receptor interaction |
Visualization of Concepts and Workflows
Diagram 1: Immunogenicity Pathway for Ligand-NPs
Diagram 2: Iterative Mitigation Development Workflow
The Scientist's Toolkit: Research Reagent Solutions
Table 3: Essential Reagents for Immunogenicity & Off-Target Studies
| Reagent/Category | Example Product (Vendor Example) | Function in Experiments |
|---|---|---|
| Ligand Conjugation Kits | SM(PEG)n Crosslinkers (Thermo), Click Chemistry Kits (Jena Bioscience) | Controlled, oriented covalent attachment of ligands to nanoparticle surfaces with variable spacer lengths. |
| Human Dendritic Cell Kits | MoDC Differentiation Kit (Miltenyi), CD14+ MicroBeads | Generate consistent in vitro human immune cell models for immunogenicity screening (Protocol 3.1). |
| Multicolor Flow Cytometry Antibodies | Anti-human CD80, CD86, HLA-DR (BioLegend) | Quantify surface activation markers on immune cells to assess nanoparticle-induced immunogenicity. |
| Cytokine ELISA Kits | Human TNF-α, IL-6, IL-12 DuoSet ELISA (R&D Systems) | Precisely measure secreted pro-inflammatory cytokines from treated immune cells. |
| Near-Infrared Dyes | Cy5.5 NHS Ester (Lumiprobe), IRDye 800CW (LI-COR) | Fluorescently label nanoparticles for in vivo and ex vivo biodistribution and off-target tracking (Protocol 3.3). |
| Pre-formed Protein Corona Analysis Columns | Size Exclusion Spin Columns (e.g., Zeba, Thermo) | Rapid separation of protein corona-nanoparticle complexes from unbound plasma proteins post-incubation. |
| Proteomics Services/Kits | In-gel TryptDigest Kit (Pierce), TMTpro 16plex (Thermo) | For detailed, quantitative analysis of hard corona protein composition and abundance (Protocol 3.2). |
| "Stealth" Co-Polymers | mPEG-DSPE (Laysan Bio), Poloxamer 407 (Sigma) | Materials for creating steric shielding layers on nanoparticles to reduce opsonization and off-target uptake. |
The future of active targeting in nanomedicine depends on a paradigm shift from merely demonstrating enhanced cellular uptake in vitro to engineering clinically viable targeted systems. This requires integrating deimmunization and off-target mitigation as core design principles from inception. The strategies and tools outlined here—spanning computational design, advanced in vitro assays, and rigorous in vivo validation—provide a framework for achieving this. Success will yield targeted nanotherapies that truly fulfill their promise: maximized delivery to the disease site with minimized immune provocation and side effects, thereby decisively proving the superiority of rational active targeting over passive accumulation.
Scale-Up and Manufacturing Challenges for Complex Targeted Systems
1. Introduction within the Thesis Context of Active vs. Passive Targeting The pursuit of sophisticated nanomedicines has bifurcated into two principal paradigms: passive targeting, reliant on the Enhanced Permeability and Retention (EPR) effect, and active targeting, which utilizes surface ligands for specific molecular recognition. While active targeting systems promise enhanced cellular uptake and therapeutic specificity, their inherent complexity introduces profound challenges during translation from laboratory-scale synthesis to industrial Good Manufacturing Practice (GMP) production. This guide details these scale-up hurdles, framing them as critical bottlenecks that often determine whether a promising actively targeted construct can evolve from a research prototype to a commercially viable therapeutic.
2. Core Scale-Up and Manufacturing Challenges
Table 1: Primary Challenges in Scaling Actively Targeted Nanosystems
| Challenge Category | Specific Issue | Impact on Active vs. Passive Systems |
|---|---|---|
| Ligand Conjugation & Orientation | Batch-to-batch consistency in coupling efficiency; controlled orientation of antibodies, peptides, or aptamers. | Critical for Active. Passive systems have no ligand, avoiding this issue. Poor control leads to variable targeting efficacy. |
| Particle Characterization | Measuring ligand density, surface coverage, and valency; stability of the ligand-corona complex. | More Complex for Active. Requires advanced analytics (e.g., SPR, HPLC-MS) beyond size/zeta potential needed for passive systems. |
| Formulation & Stability | Aggregation upon ligand attachment; chemical degradation of linkers/lignads; shear stress during processing. | Heightened for Active. Added components and surface heterogeneity reduce stability compared to simpler passive particles. |
| Cost of Goods (COGs) | High cost of GMP-grade targeting ligands (e.g., antibodies); multi-step, low-yield conjugation processes. | Prohibitive for Active. Often the primary barrier. Passive systems are inherently less expensive to manufacture. |
| Regulatory Path | Defining Critical Quality Attributes (CQAs) for a multi-component product; demonstrating ligand stability and safety. | Less Defined for Active. Regulatory expectations for complex, heterogeneous constructs are still evolving. |
3. Detailed Experimental Protocols for Key Scale-Up Studies
Protocol 1: Assessing Ligand Coupling Efficiency and Density at Pilot Scale
- Objective: Quantify the yield and consistency of ligand conjugation following a scaled-up nanoprecipitation and conjugation process.
- Materials: PLGA-PEG-COOH nanoparticles (100g batch), monoclonal antibody (mAb) ligand, EDC/NHS coupling reagents, tangential flow filtration (TFF) system with 100kDa membranes.
- Methodology:
- Scaled Conjugation: Activate carboxylated nanoparticles (10g in 1L 0.1M MES buffer, pH 5.5) with a 10-fold molar excess of EDC/NHS for 20 mins. Quench excess with glycine. Purify via TFF into conjugation buffer (PBS, pH 7.4).
- Ligand Addition: Add the mAb ligand at a 50:1 molar ratio (mAb:NP) to the stirred reactor. React for 12h at 4°C.
- Purification: Use TFF (PBS diafiltration) to remove unconjugated mAb. Concentrate to final volume.
- Analysis: Determine coupling efficiency via:
- BCA Assay: Measure protein in feed and permeate/retentate fractions.
- HPLC-SEC: Quantify free mAb peak in the final product.
- Calculations: Coupling Efficiency (%) = [(Initial mAb - Free mAb) / Initial mAb] x 100. Ligand Density = (Moles of conjugated mAb) / (Total particle number from dry weight).
Protocol 2: Forced Degradation Study for Linker Stability
- Objective: Evaluate the stability of the chemical linker (e.g., maleimide-thiol) between nanoparticle and ligand under stress conditions.
- Materials: Actively targeted nanoparticle batch, control buffers (PBS pH 7.4, acetate buffer pH 5.0), incubation at 40°C, SDS-PAGE gel apparatus.
- Methodology:
- Stress Incubation: Aliquot nanoparticles into vials containing buffers at pH 7.4 and 5.0. Incubate at 40°C. Sample at t=0, 1, 2, 4, 7, 14 days.
- Sample Preparation: Treat aliquots with SDS sample buffer (with and without reducing agent β-mercaptoethanol).
- Analysis: Run samples on non-reducing SDS-PAGE. A detectable shift in the mAb band indicates intact conjugate. The appearance of a lower molecular weight band corresponding to free mAb indicates linker cleavage. Quantify band intensity via densitometry.
4. Visualization of Key Processes
Title: Comparison of Active vs Passive NP Manufacturing Workflows
Title: Analytical Tools for Characterizing Targeted Systems
5. The Scientist's Toolkit: Essential Research Reagent Solutions
Table 2: Key Reagents & Materials for Process Development
| Item | Function/Description | Critical for Scale-Up Consideration |
|---|---|---|
| GMP-Grade Targeting Ligands | Recombinant antibodies, peptides, or aptamers produced under quality-controlled conditions. | Essential for clinical batch production. High cost is a major COG driver. |
| Heterobifunctional Crosslinkers | Chemicals (e.g., SMCC, DBCO-NHS) with two different reactive groups for controlled conjugation. | Choice impacts conjugate stability, orientation, and manufacturing reproducibility. |
| Tangential Flow Filtration (TFF) Systems | Scalable purification system to separate conjugated NPs from free ligands and exchange buffers. | Enables closed, aseptic processing; critical for moving from bench centrifugation to pilot scale. |
| Forced Degradation Study Kits | Buffers and reagents for accelerated stability studies (oxidative, thermal, pH stress). | Provides early data on linker and conjugate stability, informing formulation design. |
| Reference Standard Materials | Well-characterized batches of the targeted nanoparticle used for analytical method qualification. | Required for defining CQAs and ensuring batch-to-batch comparability in regulatory filings. |
Head-to-Head Analysis: Efficacy, Safety, and Clinical Evidence
This whitepaper exists within a broader thesis investigating the dichotomy of active vs. passive targeting in nanomedicine. The central hypothesis posits that while passive targeting via the Enhanced Permeation and Retention (EPR) effect provides foundational tumor accumulation, active targeting strategies (e.g., ligand-receptor binding) are critical for enhancing cellular internalization, specificity, and ultimately, the therapeutic index (TI). This guide provides a technical framework for quantitatively comparing these paradigms in preclinical models.
Core Preclinical Models for Tumor Accumulation Studies
Selection of an appropriate in vivo model is critical, as it dictates the relevance of EPR and targeting ligand engagement.
Subcutaneous Xenograft Models
- Protocol: Human cancer cells (e.g., MDA-MB-231, U87-MG) are injected into the flanks of immunodeficient mice (e.g., athymic nude, NSG). Tumors are grown to ~100-300 mm³.
- Utility for Thesis: Standard for initial proof-of-concept. Demonstrates passive accumulation but often lacks complex tumor microenvironment (TME) and may overstate EPR.
Orthotopic Xenograft Models
- Protocol: Cancer cells are implanted into the organ/tissue of origin in the mouse (e.g., MTCL breast cancer cells into mammary fat pad). Requires advanced imaging for tracking.
- Utility for Thesis: More accurately represents TME and vascularization, providing a rigorous test for both passive and active targeting efficiency.
Genetically Engineered Mouse Models (GEMMs) & Patient-Derived Xenografts (PDXs)
- Protocol (PDX): Fragments of human patient tumors are implanted into mice. Passaged for studies.
- Utility for Thesis: PDXs and GEMMs exhibit heterogeneous stroma and vasculature. They are the gold standard for evaluating the real-world potential of targeting strategies, as they better mimic human EPR variability.
Quantitative Metrics: From Accumulation to Therapeutic Index
Key quantitative endpoints must be measured to compare targeting strategies.
Table 1: Key Quantitative Metrics for Comparison
| Metric | Formula / Method | Interpretation for Active vs. Passive |
|---|---|---|
| % Injected Dose per Gram (%ID/g) | (Radioactivity or fluorescence in tumor / Total injected dose) / Tumor weight × 100 |
Measures gross tumor accumulation. A high value indicates strong EPR; a differential between targeted and non-targeted particles suggests active contribution. |
| Targeting Specificity Index (TSI) | (%ID/g in Tumor) / (%ID/g in Key Off-Target Organ (e.g., liver)) |
Critical for TI. Active targeting should ideally increase tumor accumulation while decreasing off-target uptake, raising TSI. |
| Cellular Internalization Fraction | Ex Vivo flow cytometry or confocal microscopy of dissociated tumor cells. | Active targeting should significantly increase this fraction compared to passive, non-targeted particles. |
| Therapeutic Index (TI) | TD₅₀ (dose toxic to 50% of subjects) / ED₅₀ (dose effective in 50% of subjects) |
The ultimate comparative metric. A successful active targeting strategy should show a higher TI than passive or free drug, due to enhanced efficacy and/or reduced toxicity. |
| Pharmacokinetic (PK) Half-lives | t₁/₂α (distribution), t₁/₂β (elimination) from plasma concentration-time data. |
Passive targeting relies on long circulation (long t₁/₂β). Active targeting must optimize PK to allow for ligand engagement without rapid clearance. |
Experimental Protocols for Direct Comparison
Dual-Label/ Dual-Population Protocol to Decouple Accumulation from Internalization
Objective: To separately quantify tumor deposition (EPR-driven) and cellular uptake (active targeting-driven).
- Synthesize two nanoparticle populations: A (Passive): Non-targeted, labeled with dye X (e.g., Cy5). B (Active): Ligand-targeted, labeled with dye Y (e.g., Cy7).
- Co-inject both populations (1:1 ratio) intravenously into tumor-bearing mice (n=5-8/group).
- At terminal timepoints (e.g., 24h, 48h), collect tumors and major organs.
- Ex Vivo Analysis:
- Whole Tissue: Image for dyes X and Y to determine total %ID/g for each population.
- Single-Cell Suspension: Create a suspension from part of the tumor. Use flow cytometry to quantify the percentage of tumor cells positive for dye X vs. dye Y. The difference directly attributes to ligand-mediated cellular binding/uptake.
Therapeutic Efficacy & TI Determination Protocol
Objective: To compare the TI of actively targeted vs. passively targeted nanomedicines.
- Formulate three arms: i) Free drug, ii) Passive nanocarrier (drug-loaded), iii) Active nanocarrier (drug-loaded, ligand-conjugated).
- Establish a dose-response for efficacy. Inject treatments into tumor-bearing mice at multiple doses (e.g., 5, 10, 20 mg drug equivalent/kg) via tail vein.
- Efficacy (ED₅₀): Monitor tumor volume over time. Fit dose-response curve to determine dose causing 50% tumor growth inhibition (ED₅₀).
- Toxicity (TD₅₀): In parallel, administer the same doses to healthy, non-tumor-bearing mice. Monitor body weight loss (>20% is a common humane endpoint), blood biomarkers (ALT, AST, BUN), and survival over 14-28 days. Determine dose causing 50% toxicity (TD₅₀).
- Calculate TI:
TI = TD₅₀ / ED₅₀. Compare across formulations.
Visualization of Concepts and Workflows
Diagram 1: Active vs Passive Targeting Pathways (94 chars)
Diagram 2: Dual-Label Protocol Workflow (100 chars)
The Scientist's Toolkit: Research Reagent Solutions
Table 2: Essential Reagents for Comparative Targeting Studies
| Item | Function & Relevance to Thesis |
|---|---|
| Fluorescent Dyes (Cy5, Cy7, ICG) | For in vivo and ex vivo imaging of nanoparticle biodistribution. Different emission spectra allow for co-tracking of multiple formulations (dual-label protocol). |
| PEGylated Phospholipids (DSPE-PEG) | The cornerstone for creating "stealth" nanoparticles that evade immune clearance, enabling the study of passive targeting (EPR effect). |
| Biotin-Streptavidin & Click Chemistry Kits | Standardized chemistries for reliable, quantitative conjugation of targeting ligands (e.g., antibodies, peptides) to nanoparticle surfaces for active targeting studies. |
| Near-Infrared (NIR) Live Animal Imagers | Systems (e.g., PerkinElmer IVIS, LI-COR Pearl) enable non-invasive, longitudinal tracking of nanoparticle accumulation in tumors versus background tissues. |
| Inductively Coupled Plasma Mass Spectrometry (ICP-MS) | The gold standard for quantitative elemental analysis (e.g., Au, Pd in inorganic NPs; tracing tagged molecules) to calculate precise %ID/g with high sensitivity. |
| Tumor Dissociation Kits (e.g., gentleMACS) | Generate single-cell suspensions from harvested tumors for downstream flow cytometry analysis of cell-specific nanoparticle uptake, differentiating tumor vs. stromal cell targeting. |
| Clinical Chemistry Analyzers & ELISA Kits | For quantifying serum biomarkers of organ toxicity (ALT, AST for liver; BUN, Creatinine for kidney) in TI studies to determine the TD₅₀. |
| Multi-parameter Flow Cytometer | Essential for quantifying the cellular internalization fraction of labeled nanoparticles in complex cell mixtures derived from tumors, providing direct evidence for active targeting. |
The clinical translation of nanomedicines represents a critical test of the principles underpinning their design, most notably the paradigms of passive and active targeting. Passive targeting relies on the Enhanced Permeability and Retention (EPR) effect, where nanocarriers accumulate preferentially in tumor tissue due to leaky vasculature and impaired lymphatic drainage. Active targeting involves the functionalization of the nanoparticle surface with ligands (e.g., antibodies, peptides) designed to bind specifically to receptors overexpressed on target cells. The successes and failures of approved nanomedicines provide a reality check for these concepts, revealing where theory aligns with clinical benefit and where significant gaps remain. This whitepaper analyzes these outcomes through a technical lens, providing data, protocols, and tools for researchers.
Part 1: Quantitative Analysis of Approved Nanomedicine Clinical Trials
The following tables summarize key clinical trial outcomes for a selection of FDA/EMA-approved nanomedicines, categorizing them by their primary targeting strategy.
Table 1: Successes - Approved Nanomedicines with Demonstrated Clinical Benefit
| Nanomedicine (Brand) | Nanoparticle Type | Targeting Strategy | Key Indication | Pivotal Trial Outcome (vs. Standard of Care) |
|---|---|---|---|---|
| Doxorubicin HCl Liposome (Doxil/Caelyx) | PEGylated Liposome | Passive (EPR) | Ovarian Cancer, KS | ORR: 45.3% vs 24.4% (in KS); significant improvement in PFS in ovarian cancer. |
| Paclitaxel Albumin-bound (Abraxane) | Albumin-bound (130 nm) | Passive (SPARC-mediated?) | Metastatic Breast Cancer | ORR: 33% vs 19% (solvent-based paclitaxel). PFS: 23.0 vs 16.9 wks. |
| Bupivacaine Liposome (Exparel) | Multivesicular Liposome | Passive (Sustained Release) | Post-op Analgesia | Significant reduction in cumulative pain score over 72h vs placebo. |
| Patisiran (Onpattro) | Lipid Nanoparticle (LNP) | Passive (Hepatocyte uptake) | hATTR Amyloidosis | mNIS+7 score change: -6.0 vs +28.0 (placebo) at 18 months. |
| mRNA COVID-19 Vaccines | LNP | Passive/Active (Ionizable lipid, APC targeting) | COVID-19 Prevention | Vaccine Efficacy: ~95% (original strain). Landmark reduction in severe disease. |
Table 2: Failures & Limitations - Trials Highlighting Nanomedicine Challenges
| Nanomedicine (Brand) | Nanoparticle Type | Targeting Strategy | Key Indication / Issue | Pivotal Trial Outcome (vs. Comparator) |
|---|---|---|---|---|
| PEGylated Liposomal Doxorubicin (in many solid tumors) | PEGylated Liposome | Passive (EPR) | Pancreatic Cancer, GBM | Often failed to show superiority over free drug or standard therapy. EPR heterogeneity is a major factor. |
| MM-302 (PEGylated liposomal doxorubicin + anti-HER2 scFv) | Immunoliposome | Active (Anti-HER2) | HER2+ Breast Cancer | Phase II: No significant improvement in PFS vs standard chemo. Failed to demonstrate added benefit of active targeting in this context. |
| VYXEOS (CPX-351) | Liposome (5:1 molar ratio) | Passive (Composition-driven) | Secondary AML | Success Example: Improved OS (9.56 vs 5.95 mos). Listed here to contrast with failures of novel targeting agents. |
| Numerous polymeric NPs, dendrimers | Various | Active (Folates, RGD peptides, etc.) | Various Solid Tumors | Attrition: Multiple candidates failed in Phase I/II due to lack of efficacy, unexpected toxicity, or manufacturing challenges. |
Part 2: Experimental Protocols for Evaluating Targeting Efficacy
Protocol 1:In VivoBiodistribution and Tumor Accumulation Study
Aim: Quantify the passive (EPR) and active targeting component of a novel nanomedicine. Materials: Fluorescently (e.g., DiR, Cy5.5) or radionuclide (e.g., ⁸⁹Zr, ¹¹¹In) labeled nanoparticles, with and without targeting ligand. Tumor-bearing mouse model (e.g., subcutaneous xenograft). Procedure:
- Administration: Inject labeled targeted (T-NP) and non-targeted (NT-NP) nanoparticles intravenously via tail vein (n=5-8 per group).
- Longitudinal Imaging: At predetermined time points (e.g., 1, 4, 24, 48, 72h), image animals using IVIS spectrum (fluorescence) or PET/SPECT/CT (radioactivity).
- Ex Vivo Quantification: At terminal time point (e.g., 72h), euthanize animals, perfuse with PBS, and harvest tumors and major organs (liver, spleen, kidneys, heart, lungs, blood).
- Tissue Processing: Weigh tissues, homogenize, and quantify fluorescence/radioactivity using a plate reader or gamma counter. Calculate % Injected Dose per Gram of tissue (%ID/g).
- Data Analysis: Compare %ID/g in tumor for T-NP vs. NT-NP (active targeting component). Compare tumor-to-muscle and tumor-to-blood ratios across groups to assess specificity.
Protocol 2:In VitroCellular Uptake and Specificity Assay
Aim: Validate ligand-receptor interaction and receptor-mediated endocytosis. Materials: Target-positive and isogenic target-negative cell lines. Fluorescently labeled T-NP and NT-NP. Flow cytometer, confocal microscope. Procedure:
- Cell Seeding: Plate cells in 12-well plates at 2x10⁵ cells/well and culture overnight.
- Pre-treatment (Blocking Study): For specificity arm, pre-treat target-positive cells with 10x molar excess of free ligand for 1h.
- Nanoparticle Incubation: Add fluorescent NPs (e.g., 50 µg/mL equivalent polymer/lipid) to cells in serum-free medium. Incubate at 37°C (for total uptake) or 4°C (for surface binding) for 2h.
- Cell Washing & Processing: Wash cells 3x with cold PBS. For flow cytometry, detach with trypsin, resuspend in PBS, and analyze fluorescence intensity (≥10,000 events). For microscopy, fix cells with 4% PFA, stain nuclei (DAPI) and actin (Phalloidin), and image.
- Analysis: Quantify mean fluorescence intensity (MFI) shift. Specific uptake = (MFI T-NP at 37°C) - (MFI T-NP at 4°C + MFI NT-NP at 37°C + Blocked control MFI).
Part 3: Visualization of Key Concepts and Pathways
Diagram 1: EPR vs Active Targeting Mechanisms
Diagram 2: Clinical Trial Outcome Analysis Workflow
Part 4: The Scientist's Toolkit: Research Reagent Solutions
Table 3: Essential Materials for Nanomedicine Targeting Research
| Reagent / Material | Function & Role in Research | Example Vendor / Product |
|---|---|---|
| DSPE-PEG(2000)-Maleimide | A lipid-PEG conjugate with a reactive maleimide group for thiol-based conjugation of targeting ligands (e.g., cysteine-containing peptides, antibody fragments) to liposome surfaces. | Avanti Polar Lipids (880151) |
| NHS-Ester Cyanine5.5 (Cy5.5) | A near-infrared fluorescent dye reactive to primary amines. Used to label nanoparticles or proteins for in vivo fluorescence imaging and biodistribution studies. | Lumiprobe (23080) |
| Desferrioxamine (DFO) p-SCN | A chelator for Zirconium-89 (⁸⁹Zr), attached via isothiocyanate group to amine-containing nanoparticles for PET imaging and quantitative biodistribution. | Macrocyclics (B-705) |
| Matrigel Basement Membrane Matrix | Used to establish orthotopic or mixed tumor xenografts that better mimic human tumor microenvironment and vasculature, providing a more realistic model for EPR evaluation. | Corning (356231) |
| Human SPARC/Albumin ELISA Kit | Quantifies Secreted Protein Acidic and Rich in Cysteine (SPARC) levels in tumor lysates or serum, potentially correlating with albumin-bound nanoparticle (e.g., Abraxane) efficacy. | R&D Systems (DY941) |
| Click-iT Plus EdU Alexa Fluor 647 Flow Cytometry Assay Kit | Assesses cell proliferation in vivo after nanotherapy. EdU is incorporated into DNA of dividing cells; Click chemistry allows fluorescence detection via flow cytometry of dissociated tumors. | Thermo Fisher (C10634) |
| Cell Meter Annexin V Binding Apoptosis Assay Kit | Detects phosphatidylserine externalization on cell membranes, a marker of early apoptosis. Used to quantify apoptotic cell death in tumors treated with cytotoxic nanomedicines. | AAT Bioquest (22846) |
| Dynabeads Protein G for Immunoprecipitation | Used to immunoprecipitate receptor-ligand or receptor-nanoparticle complexes from cell lysates to confirm binding specificity and affinity. | Thermo Fisher (10004D) |
The efficacy of nanoparticle (NP)-based drug delivery systems hinges on their ability to reach and enter target cells. Passive targeting relies on the Enhanced Permeability and Retention (EPR) effect, where NPs accumulate in leaky tumor vasculature. Active targeting employs surface ligands (e.g., antibodies, peptides) that bind specifically to receptors overexpressed on target cells, aiming to enhance specificity and cellular uptake. Quantitative analysis of targeting efficiency (the fraction of administered dose that binds the target) and internalization (the process and extent of cellular uptake) is critical for evaluating and optimizing these strategies.
Core Quantitative Metrics and Data Tables
Table 1: Key Quantitative Metrics for Targeting and Internalization
| Metric | Formula/Description | Typical Technique | Relevance to Targeting Strategy |
|---|---|---|---|
| Targeting Efficiency (TE) | (Amount of NP at target site) / (Total administered NP dose) x 100% |
In vivo imaging, Gamma counting | Measures in vivo biodistribution; differentiates passive (EPR) from active (ligand-mediated) accumulation. |
| Specificity Index (SI) | (NP uptake in target cells) / (NP uptake in control cells) |
Flow cytometry, Fluorescence microscopy | Quantifies ligand-mediated binding specificity. SI > 1 indicates active targeting. |
| Association Constant (K_a) | [Ligand-Receptor Complex] / ([Free Ligand][Free Receptor]) |
Surface Plasmon Resonance (SPR), Isothermal Titration Calorimetry (ITC) | Affinity of targeting ligand for its receptor. |
| Internalization Rate (k_int) | Rate of NP uptake over time (e.g., molecules/cell/min) |
Live-cell imaging, Temperature-shift assays | Kinetics of cellular uptake post-binding. |
| Colocalization Coefficient | Overlap coefficient (Manders' M1/M2) with endosomal/lysosomal markers |
Confocal microscopy + image analysis | Quantifies progression through endocytic pathways. |
Table 2: Comparison of Analytical Techniques
| Technique | Measured Parameter | Throughput | Quantitative Output | Key Limitation |
|---|---|---|---|---|
| Flow Cytometry | Cellular fluorescence (NP association) | High | Mean Fluorescence Intensity (MFI), % positive cells | Cannot distinguish surface-bound vs. internalized. |
| Confocal Microscopy | Spatial NP distribution | Low | Colocalization coefficients, pixel intensity | Semi-quantitative; requires careful analysis. |
| ICP-MS | Elemental NP composition (e.g., Au, Ag) | Medium | Mass of NP per cell or tissue sample (pg/cell) | Requires digestible NPs; destroys samples. |
| Surface Plasmon Resonance (SPR) | Binding kinetics & affinity | Medium | Association/dissociation rates (kon, koff), K_D | Measures purified receptor-ligand interaction only. |
| Radiolabeling (Gamma Counting) | Radioactive tracer | Medium | % Injected Dose per Gram (%ID/g) | Regulatory hurdles for radioisotopes. |
Experimental Protocols
Protocol 3.1: Differentiating Surface-Bound vs. Internalized Nanoparticles by Flow Cytometry (Acid-Strip Method)
Objective: To quantitatively distinguish nanoparticles internalized by cells from those merely adherent to the cell surface.
- Cell Preparation: Seed target cells (e.g., HER2+ SK-BR-3 for anti-HER2 NPs) in 12-well plates. Grow to 80% confluency.
- NP Incubation: Incubate cells with fluorescently labeled NPs (e.g., 50 µg/mL) in serum-free media at 4°C (binding only) or 37°C (binding + internalization) for desired time (e.g., 2h).
- Washing: Wash cells twice with ice-cold PBS to remove unbound NPs.
- Acid Stripping (Critical Step): For samples at 37°C, treat cells with 0.5 mL of acid-strip buffer (0.5 M NaCl, 0.2 M acetic acid, pH 2.5) for 5 minutes on ice to remove surface-bound NPs. Immediately neutralize with 0.5 mL of neutralization buffer (0.5 M NaCl, 0.2 M Tris base, pH 8.0). The 4°C control sample is only washed with PBS.
- Cell Harvest & Analysis: Detach cells with trypsin, wash, resuspend in PBS+2% FBS, and analyze by flow cytometry.
- Data Calculation:
- Total Cell-Associated (37°C, no strip): MFItotal.
- Internalized (37°C, acid-stripped): MFIint.
- Surface-Bound: MFItotal - MFIint.
- Specific Internalization: Subtract MFI_int of cells treated with non-targeted NPs or with receptor-blocking antibody.
Protocol 3.2: Quantifying Cellular Uptake via Inductively Coupled Plasma Mass Spectrometry (ICP-MS)
Objective: To obtain absolute, quantitative mass of nanoparticles taken up by cells.
- Exposure & Wash: Expose cells to NPs containing a unique elemental tag (e.g., Au, Ag, Gd, Pt) in a multi-well plate. Wash thoroughly 3x with PBS-EDTA to remove adherent but not internalized NPs.
- Cell Digestion: Lyse the cell monolayer with 500 µL of concentrated trace-metal-grade nitric acid (e.g., 70% HNO3) overnight at room temperature in a fume hood.
- Sample Preparation: Dilute the digestate 1:20 with ultrapure water (2% HNO3 final). Include a cell-only control and NP-only standards prepared in the same matrix.
- ICP-MS Analysis: Analyze samples using ICP-MS calibrated with serial dilutions of the elemental standard. Use an internal standard (e.g., Indium-115) to correct for instrument drift.
- Normalization: Determine the protein content of a parallel well via BCA assay or count cells in an identical well. Express uptake as
ng of element per mg of cellular proteinorpg of element per cell.
Visualizations
Diagram 1: Active Targeting & Internalization Pathway (100 chars)
Diagram 2: Acid-Strip Assay for Internalization (92 chars)
The Scientist's Toolkit: Key Reagents & Materials
| Research Reagent Solution | Function in Experiment |
|---|---|
| Fluorescently Labeled Nanoparticles (e.g., Cy5, FITC, Alexa Fluor-conjugated) | Enable detection and quantification via flow cytometry or microscopy. Core tool for tracking. |
| Specific Receptor-Blocking Antibody | Serves as a negative control to confirm active targeting mechanism by competitively inhibiting NP binding. |
| Acid-Strip Buffer (Low pH: Acetic Acid/Citrate) | Selectively removes surface-bound, pH-sensitive ligands/NPs without affecting internalized material. Critical for differential measurement. |
| Endosomal/Lysosomal Markers (e.g., anti-EEA1, anti-LAMP1 antibodies, LysoTracker dyes) | Used in confocal microscopy to determine intracellular trafficking fate via colocalization analysis. |
| ICP-MS Elemental Standards (e.g., Au, Ag standard solutions) | Essential for calibrating the ICP-MS to convert signal intensity into absolute mass of NP element per sample. |
| Trypan Blue or Similar Quencher | Used in fluorescence microscopy to quench extracellular fluorescence, aiding in distinguishing internalized signal. |
| Protease Inhibitor Cocktail | Added to cell lysates during NP preparation for western blot or ELISA analysis of downstream signaling triggered by NP internalization. |
The fundamental challenge in nanomedicine is ensuring therapeutic agents accumulate at the diseased site while minimizing off-target effects. The Enhanced Permeability and Retention (EPR) effect, the cornerstone of passive targeting, relies on the leaky vasculature and poor lymphatic drainage common in pathologies like tumors. While this strategy has led to clinical successes (e.g., Doxil), its efficacy is highly variable across patients and tumor types. Active targeting involves decorating nanocarriers with targeting ligands (antibodies, peptides, aptamers) that bind specifically to receptors overexpressed on target cells. This promises enhanced cellular uptake and selectivity. However, the synthesis and biological performance of actively targeted nanoparticles are significantly more complex. This analysis provides a technical framework to evaluate the cost-benefit and complexity of active targeting in therapeutic development.
Quantitative Data Comparison: Efficacy, PK/PD, and Cost
Table 1: Comparative Efficacy Metrics of Passive vs. Active Targeted Nanocarriers
| Metric | Passive Targeting (EPR-based) | Active Targeting (Ligand-mediated) | Key Studies & Notes |
|---|---|---|---|
| Tumor Accumulation (% Injected Dose/g) | 0.5-3.5% ID/g | 1.5-8.5% ID/g | Active shows 2-5x increase in ideal models (e.g., anti-HER2 liposomes). |
| Cellular Internalization | Primarily via non-specific endocytosis. | Receptor-mediated endocytosis, 10-100x increase in cell association. | Critical for drugs with intracellular targets (e.g., siRNA, DNA). |
| In Vivo Therapeutic Efficacy (Tumor Growth Inhibition) | Moderate; often delays growth. | Often superior; can induce regression in sensitive models. | Efficacy highly dependent on target receptor availability and heterogeneity. |
| Pharmacokinetic Half-life | Long (e.g., 20-80 hrs), optimized by PEGylation. | Often reduced (e.g., 10-50 hrs) due to accelerated clearance and "binding site barrier." | Ligand can increase immunogenicity and RES uptake. |
| Inter-patient & Inter-tumor Variability | Very High (EPR effect is heterogeneous). | Potentially Lower, but dependent on receptor expression. | Active targeting may require companion diagnostics. |
Table 2: Complexity & Cost Analysis
| Parameter | Passive Targeting | Active Targeting | Impact on Development |
|---|---|---|---|
| Formulation Complexity | Moderate (control size, surface charge, PEG density). | High (ligand conjugation, orientation, batch consistency). | Requires advanced analytics (e.g., ligand quantification). |
| CMC & Manufacturing Cost | Relatively Lower | 2-5x Higher | Cost of ligand, additional conjugation/purification steps. |
| Regulatory Pathway | Established for liposomes, polymer micelles. | More complex; need validation of ligand stability, targeting specificity. | Potential for immunogenicity assessment. |
| Lead Time to IND | Shorter | 6-18 months longer | Due to conjugation process development and characterization. |
Experimental Protocols for Critical Evaluations
Protocol 1:In VitroTargeting Specificity and Uptake Assay
Objective: Quantify receptor-specific cellular association and internalization of targeted vs. non-targeted nanoparticles.
- Nanoparticle Preparation: Prepare identical fluorescent (e.g., Cy5.5-labeled) PEGylated liposomes. For active targeting, conjugate anti-human EGFR Fab’ fragments via maleimide-thiol chemistry to terminal PEG groups. Purify via size-exclusion chromatography.
- Cell Culture: Use EGFR+ (A431) and EGFR- (MCF-7) cell lines. Seed in 24-well plates (50,000 cells/well) 24h prior.
- Binding/Internalization: Incubate cells with nanoparticles (100 µM lipid) in serum-free media at 4°C (binding only) or 37°C (internalization) for 2h.
- Analysis: Wash, trypsinize, and analyze by flow cytometry. For internalization specificity, include a 10-fold excess of free anti-EGFR antibody as a competitive inhibitor.
- Data: Calculate mean fluorescence intensity (MFI). Specific uptake = (MFI₃₇°C - MFI₄°C) for targeted particle - same for non-targeted particle.
Protocol 2:In VivoBiodistribution and Efficacy Study
Objective: Compare tumor accumulation and therapeutic effect in a xenograft model.
- Model: Establish subcutaneous EGFR+ tumor xenografts (e.g., A431) in nude mice.
- Formulations: Prepare four formulations: i) Saline control, ii) Free drug, iii) Passive drug-loaded nanoparticle, iv) Active (anti-EGFR) drug-loaded nanoparticle.
- Dosing: Administer via tail vein at equivalent drug dose (e.g., 5 mg/kg doxorubicin) on days 0, 4, 8.
- Biodistribution: In a parallel cohort, inject DiR-labeled nanoparticles. Image using IVIS at 24, 48, 72h post-injection. Harvest organs at 72h for ex vivo fluorescence quantification (%ID/g).
- Efficacy: Monitor tumor volume and body weight 3x weekly. Calculate tumor growth inhibition index at day 21. Perform immunohistochemistry on tumors for drug presence and apoptosis (TUNEL assay).
Visualizing Key Pathways and Workflows
Mechanisms of Nanoparticle Delivery to Tumors
Active Targeting: Conjugation and Intracellular Fate
The Scientist's Toolkit: Essential Research Reagents
Table 3: Key Reagents for Active Targeting Nanoparticle Research
| Reagent / Material | Function & Rationale | Example Vendor / Product |
|---|---|---|
| DSPE-PEG(2000)-Maleimide | Phospholipid-PEG conjugate. Maleimide group reacts with thiolated ligands for surface functionalization. Essential for controlled orientation. | Avanti Polar Lipids, Nanocs. |
| Traut's Reagent (2-Iminothiolane) | Introduces sulfhydryl (-SH) groups onto antibodies, proteins, or peptides for maleimide-thiol conjugation. | Thermo Fisher Scientific. |
| Size-Exclusion Chromatography (SEC) Columns | Critical for purifying conjugated nanoparticles from unreacted ligands. Sepharose CL-4B or FPLC systems (e.g., Superose 6). | Cytiva, Bio-Rad. |
| Fluorescent Lipophilic Dyes (DiD, DiR) | Incorporate into nanoparticle membrane for in vitro and in vivo tracking by flow cytometry or IVIS imaging. | Thermo Fisher, Lumiprobe. |
| Target-Specific Ligands (e.g., Folic Acid, cRGDfK peptide) | Model targeting moieties for proof-of-concept studies. cRGD targets αvβ3 integrin on tumor vasculature. | Sigma-Aldrich, MedChemExpress. |
| Receptor-Negative Cell Line | Essential control for evaluating targeting specificity in in vitro assays (e.g., EGFR- vs. EGFR+ pairs). | ATCC. |
| Anti-PEG ELISA Kit | Quantifies anti-PEG antibodies in serum, which can be induced by PEGylated nanoparticles and alter pharmacokinetics. | Alpha Diagnostic International. |
Synthesis and Strategic Recommendations
The decision to pursue active targeting is not binary but must be context-dependent. Active targeting is "worth the effort" when:
- The therapeutic payload requires intracellular delivery (e.g., nucleic acids, proteins).
- The target receptor is highly and homogenously overexpressed on the target cell population, with low expression on critical off-target sites.
- The disease site has a poor or variable EPR effect (e.g., many primary tumors, metastases).
- The increased complexity and cost can be justified by a significant therapeutic index improvement over the standard of care.
Conversely, passive targeting remains a viable strategy for cytotoxic drugs where the goal is local slow release in the tumor interstitium, particularly when manufacturing simplicity, lower cost, and a more straightforward regulatory path are priorities.
Future development hinges on overcoming the "binding site barrier," engineering stimuli-responsive ligands to minimize off-target binding, and employing multi-ligand approaches to address tumor heterogeneity. A rigorous, stage-gated evaluation using the protocols and metrics outlined here is crucial for making data-driven decisions in nanomedicine design.
The foundational thesis of modern nanomedicine is the dichotomy between passive and active targeting. Passive targeting relies on the Enhanced Permeability and Retention (EPR) effect, where nanocarriers (typically 10-200 nm) accumulate preferentially in tumor tissue due to its leaky vasculature and poor lymphatic drainage. While historically significant, the EPR effect is highly heterogeneous across tumor types and patients, leading to variable therapeutic outcomes and significant off-target distribution.
Active targeting involves the surface functionalization of nanocarriers with ligands (e.g., antibodies, peptides, aptamers) that bind to specific receptors overexpressed on target cells. While this promises enhanced cellular uptake, it often fails in vivo due to biological barriers (protein corona formation, interstitial pressure) and the "binding-site barrier" effect, where strong binding at the periphery prevents deep tumor penetration.
This whitepaper argues for a paradigm shift towards context-responsive and adaptive hybrid nanocarriers. These systems transcend the active/passive binary by integrating multiple stimulus-responsive components and bio-inspired logic-gated functionalities, enabling them to sense their microenvironment and adapt their properties in situ for optimal spatiotemporal control.
Core Design Principles & Quantitative Benchmarks
Contemporary hybrid systems are engineered with layered functionalities. Key performance metrics from recent literature (2023-2024) are summarized below.
Table 1: Performance Benchmarks of Recent Adaptive Nanocarrier Systems
| System Core | Responsive Element(s) | Target Stimulus | Payload | Reported Efficacy (vs. Control) | Key Metric |
|---|---|---|---|---|---|
| Polymer-Lipid Hybrid | pH-sensitive polymer matrix, MMP-9 cleavable PEG | Tumor microenvironment (pH 6.5, MMP-9) | Doxorubicin & siRNA | 85% tumor growth inhibition | Tumor weight reduction at day 21 |
| Metal-Organic Framework (MOF) | Fe³⁺ nodes, thermally-labile gatekeeper | Alternating Magnetic Field (AMF) & pH | Gemcitabine | 92% cell killing in vitro | IC₅₀ reduction to 0.8 µM |
| DNA Origami Cage | ATP & pH-responsive aptamer locks | High ATP (>5 mM), pH <7.0 | Antisense oligonucleotide | 3.5-fold increase in tumor accumulation | Fluorescence intensity (IVIS) |
| Mesoporous Silica with Lipid Bilayer | ROS-sensitive linkers, cell-penetrating peptide (shielded) | Intracellular ROS > 50 µM | CRISPR-Cas9 RNP | 70% gene editing efficiency in vivo | Target protein knockdown |
| Dual-Responsive Polymerosome | Hypoxia-sensitive nitroimidazole, glutathione (GSH) cleavable crosslinks | pO₂ < 10 mmHg, GSH >10 mM | Oxygen sensor & Prodrug | 4.2-fold increase in hypoxia-specific activation | Bioluminescence Ratio |
Detailed Experimental Protocol: Synthesis & Characterization of a pH/Redox Dual-Responsive Hybrid Nanocarrier
Objective: To synthesize and characterize a polymeric nanoparticle core with a lipid bilayer shell, responsive to endosomal pH and cytoplasmic glutathione (GSH).
Materials:
- Poly(ethylene glycol)-b-poly(aspartic acid) (PEG-PAsp, 5 kDa-10 kDa)
- Cystamine dihydrochloride (redox-sensitive crosslinker)
- 1-Ethyl-3-(3-dimethylaminopropyl)carbodiimide (EDC) / N-Hydroxysuccinimide (NHS)
- DOPC, DSPE-PEG2000, DSPE-PEG2000-Folate (lipids)
- Dialysis tubing (MWCO 3.5 kDa and 50 kDa)
- Dynamic Light Scattering (DLS) / Zeta Potential Analyzer
- Transmission Electron Microscope (TEM) with negative stain (uranyl acetate)
Procedure:
Step 1: Synthesis of Redox-Sensitive Core.
- Dissolve 50 mg PEG-PAsp in 5 mL MES buffer (0.1 M, pH 6.0).
- Add 1.5 molar equivalents of EDC and NHS to the polymer solution, activate for 15 min.
- Add a 0.8 molar equivalent of cystamine dihydrochloride (relative to PAsp carboxyl groups). React for 12 hrs under nitrogen at room temperature.
- Dialyze the reaction mixture against DI water (MWCO 50 kDa) for 24 hrs to remove unreacted agents.
- Lyophilize to obtain the crosslinked polymer (CP).
Step 2: Drug Loading & Nanoparticle Formation.
- Dissolve 10 mg of CP and 2 mg of model drug (e.g., Doxorubicin HCl) in 2 mL DMSO.
- Add this solution dropwise into 10 mL of rapidly stirring PBS (pH 7.4).
- Stir for 3 hrs to allow nanoparticle self-assembly and drug encapsulation.
- Dialyze against PBS (MWCO 3.5 kDa) for 12 hrs to remove DMSO and unencapsulated drug.
Step 3: Lipid Bilayer Coating (Hybridization).
- Prepare a lipid film by evaporating a chloroform solution containing DOPC, DSPE-PEG2000, and DSPE-PEG2000-Folate (molar ratio 80:18:2) under vacuum.
- Hydrate the lipid film with the CP nanoparticle suspension from Step 2.
- Subject the mixture to 5 cycles of freeze-thawing, followed by extrusion 11 times through a polycarbonate membrane (100 nm pore size).
Step 4: Characterization.
- Measure hydrodynamic diameter and PDI by DLS in PBS and in acetate buffer (pH 5.0).
- Measure zeta potential before and after lipid coating.
- For TEM, deposit a sample on a carbon-coated grid, stain with 2% uranyl acetate, and image.
- Determine drug loading content (DLC) and encapsulation efficiency (EE) via HPLC.
Step 5: In Vitro Responsiveness Assay.
- Incubate nanoparticles (0.1 mg/mL) in the following buffers: (A) PBS (pH 7.4), (B) Acetate buffer (pH 5.0), (C) Acetate buffer (pH 5.0) + 10 mM GSH.
- Monitor size change by DLS at 0, 1, 2, 4, and 8 hrs.
- Measure drug release by dialyzing nanoparticle suspension against the same buffers and quantifying released drug via fluorescence/HPLC.
Signaling Pathways in Nanocarrier-Cell Interaction
Title: Adaptive Nanocarrier Journey from Injection to Intracellular Delivery
The Scientist's Toolkit: Essential Research Reagents & Materials
Table 2: Key Reagent Solutions for Developing Adaptive Nanocarriers
| Reagent / Material | Supplier Examples | Primary Function in Research |
|---|---|---|
| Block Co-polymers (e.g., PLGA-PEG, PEG-PAsp) | Sigma-Aldrich, PolySciTech, Nanosoft | Forms core nanoparticle structure; PEG provides "stealth," other block enables functionalization. |
| Stimuli-Responsive Linkers (DTSSP, SPDP, Azide linkers) | Thermo Fisher, BroadPharm | Enables conjugation of ligands/tags via cleavable (redox, pH, enzyme) bonds. |
| Functional Lipids (DSPE-PEG-COOH, DSPE-PEG-Biotin) | Avanti Polar Lipids, NOF America | Facilitates hybrid lipid coating and modular surface functionalization. |
| Targeting Ligands (Folate, cRGDfK peptide, Transferrin) | Fisher Scientific, MedChemExpress | Confers active targeting capability to overexpressed cellular receptors. |
| Fluorescent Probes (DiD, DIR, Cy5.5-NHS ester) | Lumiprobe, AAT Bioquest | Enables in vitro and in vivo tracking of nanoparticles via fluorescence imaging. |
| Size Exclusion Chromatography Columns (Sepharose CL-4B) | Cytiva | Purifies nanoparticles from unencapsulated drugs or unconjugated ligands. |
| Dialysis Membranes (Spectra/Por, varying MWCO) | Repligen | Removes organic solvents, free monomers, and small molecules during synthesis. |
| Extruder & Polycarbonate Membranes (50-400 nm) | Northern Lipids, Avanti | Produces uniform, monodisperse liposomes and hybrid nanoparticles. |
Experimental Workflow for Validating Adaptive Behavior
Title: Validation Workflow for Adaptive Nanocarrier Development
The future of nanomedicine lies in moving beyond the simplistic active versus passive debate. Context-responsive and adaptive hybrid systems represent a sophisticated integration of both principles. They leverage passive accumulation via the EPR effect as a first-order targeting mechanism, then deploy active, stimulus-triggered changes in their physicochemical identity to overcome subsequent biological barriers. This requires a deep interdisciplinary synthesis of materials science, molecular biology, and pharmacokinetics. The experimental frameworks and toolkits outlined here provide a foundational roadmap for researchers to engineer the next generation of "intelligent" therapeutics capable of making context-dependent decisions in vivo, ultimately aiming to maximize therapeutic index and clinical translatability.
Conclusion
The dichotomy between active and passive targeting is evolving into a more integrated paradigm. While passive targeting via the EPR effect provides the foundational 'bulk transport' to pathological sites, active targeting offers precision for specific cellular entry and subcellular delivery. However, challenges like heterogeneity, the protein corona, and manufacturing complexity remain significant hurdles. The future lies in intelligent, multi-stage systems that sequentially exploit passive and active mechanisms, or that use stimuli-responsive triggers to activate targeting ligands specifically at the disease site. Success will depend on a deeper understanding of disease biology, advanced materials engineering, and robust clinical validation, ultimately enabling a new generation of personalized, effective, and safe nanotherapeutics.