Quantifying Biomaterial Degradation: A Comprehensive Guide to SEC, HPLC, and NMR Analytical Techniques
This article provides researchers, scientists, and drug development professionals with a detailed framework for analyzing biomaterial degradation products using Size Exclusion Chromatography (SEC), High-Performance Liquid Chromatography (HPLC), and Nuclear Magnetic...
Quantifying Biomaterial Degradation: A Comprehensive Guide to SEC, HPLC, and NMR Analytical Techniques
Abstract
This article provides researchers, scientists, and drug development professionals with a detailed framework for analyzing biomaterial degradation products using Size Exclusion Chromatography (SEC), High-Performance Liquid Chromatography (HPLC), and Nuclear Magnetic Resonance (NMR) spectroscopy. We cover foundational principles of degradation mechanisms, method development and application workflows, troubleshooting common analytical challenges, and validation strategies for regulatory compliance. By integrating these complementary techniques, this guide enables precise quantification of oligomers, monomers, and chemical by-products, critical for assessing material safety, performance, and biocompatibility in biomedical applications.
Biomaterial Degradation Fundamentals: Why Quantifying Products is Critical for Safety & Performance
Application Notes: Pathways in the Context of Analytical Quantification
Understanding the degradation pathways of biomaterials (e.g., poly(lactic-co-glycolic acid) (PLGA), polycaprolactone (PCL), polyurethanes) is critical for predicting implant lifespan, drug release profiles, and biocompatibility. Within a thesis employing SEC-HPLC-NMR for quantifying degradation products, characterizing these pathways provides the chemical context for identifying the oligomers and monomers detected.
Hydrolytic Degradation: The dominant mechanism for many polyesters. Water penetrates the biomaterial, cleaving hydrolytically susceptible bonds (e.g., ester linkages in PLGA). The rate depends on material crystallinity, molecular weight, and local pH (autocatalysis). SEC-HPLC-NMR can track the decrease in polymer molecular weight (SEC), separate different oligomeric species (HPLC), and identify end-group structures (e.g., carboxylic vs. hydroxyl) via NMR.
Oxidative Degradation: Mediated by reactive oxygen species (ROS) from inflammatory cells or metal-catalyzed reactions. It affects polyurethanes and polyethylene. It causes chain scission and cross-linking, leading to embrittlement. NMR is crucial for identifying oxidative products (e.g., carbonyls, peroxides) that differ from hydrolytic products.
Enzymatic Degradation: Enzyme-specific (e.g., proteases, esterases, collagenases) cleavage, often exhibiting surface erosion. Relevant for natural polymers (collagen) and some synthetics. HPLC-NMR can identify enzyme-specific cleavage fragments, providing insight into in vivo degradation mechanisms.
Quantitative Data Summary
Table 1: Characteristics of Primary Biomaterial Degradation Pathways
| Pathway | Key Cleavage Mechanism | Primary Influencing Factors | Typical Biomaterials Affected | Key Degradation Products |
|---|---|---|---|---|
| Hydrolytic | Nucleophilic attack by water on polar bonds | pH, temperature, crystallinity, copolymer ratio | PLGA, PCL, PGA, PLA | Lactic acid, glycolic acid, caproic acid oligomers |
| Oxidative | Radical-mediated chain scission & oxidation | ROS concentration, transition metal ions, site of implantation | Polyurethanes, Polyethylene, PVA | Carbonyls (ketones, aldehydes), peroxides, chain fragments |
| Enzymatic | Enzyme-substrate specific catalysis | Enzyme type/concentration, surface accessibility | Collagen, gelatin, chitosan, some polyesters | Specific peptides, monosaccharides, tailored oligomers |
Table 2: Analytical Signatures for SEC-HPLC-NMR Monitoring
| Degradation Pathway | SEC Trend (Mw vs. Time) | HPLC Peak Evolution | Characteristic NMR Shifts (¹H/¹³C) |
|---|---|---|---|
| Hydrolytic (Bulk Erosion) | Rapid initial decrease, broad dispersity | Increase in low-MW oligomer peaks over time | New -COOH end-group signals (~12-13 ppm ¹H); ester carbonyl shift (175-180 ppm ¹³C) change. |
| Oxidative | Decrease, possible high-Mw tail (cross-linking) | Complex mixture of oxidized species | New aldehydic protons (~9-10 ppm ¹H); ketone carbonyls (210-220 ppm ¹³C). |
| Enzymatic (Surface Erosion) | Slow, steady decrease; core-shell profile | Appearance of specific dimer/trimer fragments | Distinct end-group patterns indicative of enzymatic cleavage site. |
Experimental Protocols
Protocol 1: Accelerated Hydrolytic Degradation of PLGA for Product Analysis
Objective: Generate time-point samples for SEC-HPLC-NMR analysis of hydrolytic degradation products. Materials: PLGA (50:50) film/microspheres, Phosphate Buffered Saline (PBS) pH 7.4, 37°C shaking incubator, lyophilizer. Procedure:
- Weigh and place samples (n=5 per time point) in vials with 10 mL PBS (0.1 M, pH 7.4).
- Incubate at 37°C under constant agitation (50 rpm).
- Retrieve vials at predetermined intervals (e.g., 1, 7, 14, 28, 56 days).
- At each time point: a) Filter the buffer, lyophilize, and store for water-soluble product analysis. b) Rinse the residual solid polymer with DI water, lyophilize, and store.
- Prepare samples for SEC-HPLC-NMR:
- Solid Residue: Dissolve in appropriate SEC solvent (e.g., THF or DMF with LiBr).
- Lyophilized Buffer Solubles: Reconstitute in deuterated solvent (e.g., D₂O) for direct NMR or LC-NMR mobile phase.
Protocol 2: In Vitro Oxidative Degradation of Polyurethane
Objective: Simulate inflammatory oxidative environment to generate products for LC-NMR identification. Materials: Polyurethane film, CoCl₂ (catalyst), H₂O₂ (30%), PBS, 37°C incubator. Procedure:
- Prepare oxidative medium: 20 mM H₂O₂ and 0.1 mM CoCl₂ in PBS (prepare fresh).
- Immerse weighed polymer samples (n=5) in 10 mL of oxidative medium. Controls in PBS alone.
- Incubate at 37°C. Replace the medium every 48h to maintain oxidant activity.
- At time points, remove samples. Rinse extensively with DI water containing antioxidant (e.g., 0.1% BHT).
- Lyophilize the rinse water and the residual solid separately.
- Analyze the solid residue by SEC for Mw changes. Analyze both fractions by HPLC-NMR, targeting carbonyl region (¹³C NMR) for ketone/aldehyde formation.
Protocol 3: Enzymatic Degradation of Collagen with Trypsin
Objective: Produce specific peptide fragments for identification by LC-NMR. Materials: Type I Collagen sponge, Trypsin (TPCK-treated), Tris-HCl buffer (pH 7.6), 37°C water bath. Procedure:
- Prepare enzymatic solution: 0.1% (w/v) trypsin in 50 mM Tris-HCl, 1 mM CaCl₂, pH 7.6.
- Immerse pre-weighed collagen samples in enzyme solution (10 mL per 100 mg sample).
- Incubate at 37°C with gentle shaking for 2-24 hours.
- Terminate reaction by adding 1 mL of 10% (v/v) acetic acid and cooling on ice.
- Centrifuge (10,000 x g, 10 min). Filter supernatant (0.22 µm).
- Lyophilize the supernatant. Reconstitute in D₂O-based buffer for direct NMR or inject onto a reversed-phase HPLC system coupled to NMR for separation and structural identification of primary cleavage fragments.
Visualizations
Diagram Title: Biomaterial Degradation & SEC-HPLC-NMR Analysis Workflow
Diagram Title: Hydrolytic Degradation Sample Prep Protocol
The Scientist's Toolkit: Research Reagent Solutions
Table 3: Essential Materials for Biomaterial Degradation Studies with SEC-HPLC-NMR
| Item | Function/Application | Key Consideration |
|---|---|---|
| Deuterated Solvents (e.g., D₂O, CDCl₃, DMSO-d₆) | NMR spectroscopy to provide lock signal and avoid solvent interference. | Purity (>99.8% D), appropriate solvent for polymer (CDCl₃ for many polyesters). |
| SEC Standards (e.g., PMMA, PS) | Calibration of SEC columns for accurate molecular weight determination. | Narrow dispersity standards matching polymer chemistry. |
| LC-NMR Compatible Mobile Phase (e.g., ACN/D₂O) | HPLC separation with NMR-compatible, deuterated, or proton-suppressed solvents. | Minimal ¹H background; often requires solvent suppression techniques. |
| PBS Buffer (Deuterated or 10% D₂O) | Provides physiological ionic strength/pH for in vitro degradation; D₂O portion enables NMR. | pH adjustment post-deuteration may be needed. |
| Enzymes (e.g., Trypsin, Collagenase, Esterase) | To catalyze enzymatic degradation pathways in controlled in vitro studies. | Purity, activity units, and specific buffer requirements. |
| ROS Generators (e.g., H₂O₂, CoCl₂) | To simulate oxidative stress environments in vitro. | Concentration must be physiologically relevant; prepare fresh. |
| Lyophilizer | To isolate non-volatile degradation products from aqueous media for analysis. | Ensures complete removal of water (¹H NMR interference). |
| 0.22 µm PTFE Filters | Sterile filtration of degradation media and solvents for HPLC. | Chemically inert to avoid introducing contaminants. |
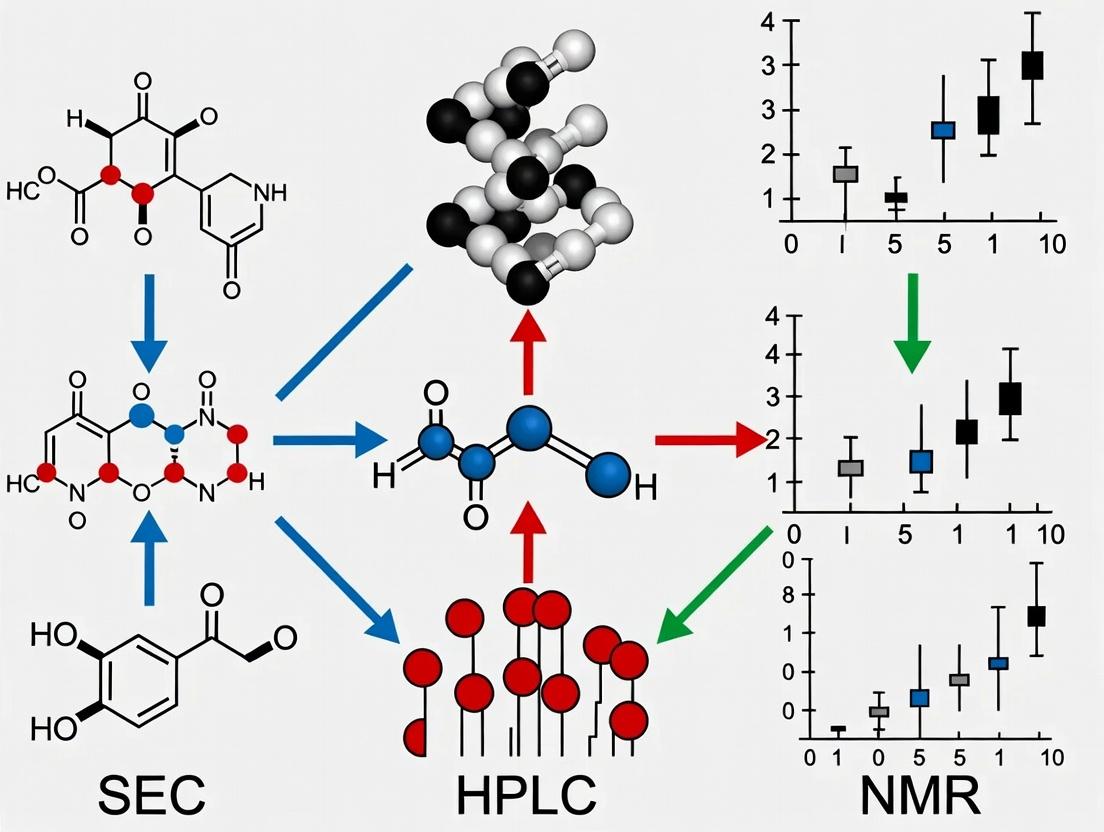
The comprehensive characterization of biomaterial degradation products—specifically oligomers, monomers, additives, and chemical by-products—is critical for assessing biocompatibility, safety, and performance. This application note details integrated Size Exclusion Chromatography (SEC), High-Performance Liquid Chromatography (HPLC), and Nuclear Magnetic Resonance (NMR) protocols for the identification and quantification of these species, as part of a broader thesis on advanced analytical techniques in biomaterial science.
Table 1: Typical SEC-HPLC Quantification Ranges for Poly(L-lactide-co-glycolide) (PLGA) Degradation
| Product Type | Molecular Weight Range (Da) | Retention Time Range (SEC, min) | Typical Concentration in PBS (37°C, 28 days) (µg/mL) | Primary HPLC Column |
|---|---|---|---|---|
| High MW Oligomers | 5,000 - 20,000 | 8.2 - 9.5 | 120 - 450 | Phenogel 5µ 10E4Å |
| Low MW Oligomers | 500 - 5,000 | 10.5 - 12.8 | 250 - 1100 | Phenogel 5µ 500Å |
| Lactide Monomer | 72 | 14.2 | 85 - 320 | C18 Reverse Phase |
| Glycolide Monomer | 58 | 13.8 | 60 - 280 | C18 Reverse Phase |
| Additive (e.g., PEG) | 1,000 - 5,000 | 9.8 - 11.2 | 10 - 50 (residual) | TSK-Gel SuperAW3000 |
| By-Product (Acidic End-group) | N/A | 5.1 (Ion-Exchange) | 150 - 600 | Ion-Exchange HPLC |
Table 2: Characteristic NMR Chemical Shifts for Identification
| Degradation Product | ¹H NMR δ (ppm) in DMSO-d6 | ¹³C NMR δ (ppm) in DMSO-d6 | Key Functional Group |
|---|---|---|---|
| L-Lactide | 1.55 (d, 3H, CH3), 5.15 (q, 1H, CH) | 169.5 (C=O), 66.8 (CH), 16.2 (CH3) | Ester, Aliphatic |
| Glycolide | 4.95 (s, 2H, CH2) | 167.0 (C=O), 60.1 (CH2) | Ester |
| Lactic Acid | 1.35 (d, 3H, CH3), 4.25 (q, 1H, CH), 12.4 (s, 1H, COOH) | 177.8 (COOH), 65.9 (CH), 20.1 (CH3) | Carboxylic Acid |
| PLGA Oligomer (dyad) | 5.2 (m, 1H, Lactyl CH), 4.85 (s, 2H, Glycolyl CH2), 1.55 (d, 3H, Lactyl CH3) | 169.0-166.0 (C=O region), 60-70 (CH/CH2) | Ester Backbone |
Experimental Protocols
Protocol 3.1: Integrated SEC-HPLC for Separation and Quantification
Objective: To separate and quantify oligomers, monomers, and additives from in vitro degradation media.
Materials:
- HPLC System: Binary pump, autosampler, column oven, RI and UV detectors.
- SEC Columns: Phenogel 5µ 10E4Å and 500Å in series.
- Mobile Phase: HPLC-grade Tetrahydrofuran (THF) with 0.1% trifluoroacetic acid (TFA). Filter (0.22 µm) and degas.
- Standards: Polystyrene standards (for calibration), lactide, glycolide, PEG.
- Samples: Filtered (0.45 µm PTFE) degradation medium or polymer extract.
Method:
- System Preparation: Equilibrate SEC columns with THF+0.1%TFA at 1.0 mL/min for 60 min. Set column oven to 35°C. Set RI detector temperature to 40°C.
- Calibration: Inject 50 µL of polystyrene standard mix. Construct log(MW) vs. retention time calibration curve.
- Sample Analysis: Inject 50 µL of filtered sample. Run isocratic elution for 25 minutes.
- Data Analysis: Identify peaks by retention time vs. calibration. Quantify using external standard curves (lactide, glycolide) for monomers and area normalization for oligomer fractions.
Protocol 3.2: NMR Sample Preparation and Acquisition for Structural Elucidation
Objective: To confirm the chemical structure of isolated degradation products.
Materials:
- NMR Spectrometer: 400 MHz or higher.
- Solvent: Deuterated dimethyl sulfoxide (DMSO-d6) or Chloroform (CDCl3).
- NMR Tubes: 5 mm.
- Sample: Lyophilized fraction from SEC-HPLC run.
Method:
- Sample Preparation: Dissolve 2-5 mg of lyophilized sample in 0.6 mL of DMSO-d6. Vortex until fully dissolved.
- Acquisition:
- ¹H NMR: Standard zg pulse sequence. 64 scans, 10 sec relaxation delay. Reference residual DMSO peak at 2.50 ppm.
- ¹³C NMR: Standard zgpg30 pulse sequence (inverse-gated decoupling to minimize NOE). 1024 scans, 5 sec relaxation delay. Reference DMSO central peak at 39.52 ppm.
- 2D Experiments (if needed): Perform ¹H-¹H COSY and ¹H-¹³C HSQC for complex oligomer assignment.
- Processing & Integration: Apply Fourier transform, phase, and baseline correction. Integrate characteristic peaks and calculate ratios (e.g., lactyl:glycolyl units).
Protocol 3.3: AcceleratedIn VitroDegradation Study
Objective: To generate degradation products for analysis under controlled conditions.
Materials:
- Biomaterial: PLGA film (50:50, MW ~30 kDa).
- Buffer: Phosphate Buffered Saline (PBS, pH 7.4) with 0.02% sodium azide.
- Incubation: Shaking water bath or incubator at 37°C ± 0.5°C.
- Containers: Sterile, sealed vials.
Method:
- Sample Preparation: Weigh and place PLGA films (n=5 per time point) in vials. Add PBS at a 1:100 (w/v) ratio.
- Incubation: Place vials in a shaking incubator (60 rpm) at 37°C.
- Sampling: At predetermined time points (e.g., 1, 7, 14, 28 days), remove vials in triplicate.
- Workup: Filter the buffer medium (0.45 µm). Retain for soluble product analysis (SEC-HPLC). Lyophilize the remaining polymer and soluble fraction for NMR analysis.
Visualizations
Diagram Title: Integrated SEC-HPLC NMR Degradation Analysis Workflow
Diagram Title: Product Identification Logic from Combined Data
The Scientist's Toolkit: Essential Research Reagents & Materials
Table 3: Key Reagent Solutions for SEC-HPLC-NMR Degradation Studies
| Reagent/Material | Function | Key Consideration |
|---|---|---|
| THF + 0.1% TFA (HPLC Grade) | Mobile phase for SEC. TFA suppresses carboxylic acid group ionization, improving peak shape. | Must be freshly purified/stabilized to prevent peroxide formation. |
| DMSO-d6 (99.9% D) | Primary NMR solvent for degradation products. Excellent solubility for polar oligomers and acids. | Hygroscopic; store over molecular sieves. |
| PBS Buffer (with 0.02% NaN3) | In vitro degradation medium. Azide prevents microbial growth. | pH must be monitored and adjusted periodically during long-term studies. |
| Polystyrene Calibration Kit | Provides molecular weight calibration curve for SEC. | Narrow dispersity (Đ) standards recommended. |
| PTFE Syringe Filters (0.45 µm) | Clarifies degradation medium prior to injection, preventing column damage. | Low protein/analyte binding is critical. |
| Reference Standards (Lactide, Glycolide, Lactic Acid) | Enables quantitative HPLC and peak identification via spiking. | High purity (>99%) required for accurate calibration. |
| Deuterated Solvent for Lock (e.g., D2O) | Used in an external capillary for NMR field frequency lock when using non-deuterated eluents from prep-HPLC. | Ensures stable NMR signal during long 2D or ¹³C experiments. |
Within biomaterial degradation research, comprehensive analysis requires orthogonal techniques. Size Exclusion Chromatography (SEC) separates by hydrodynamic volume, High-Performance Liquid Chromatography (HPLC) resolves by chemical affinity, and Nuclear Magnetic Resonance (NMR) provides definitive structural identification. This triad enables precise quantification and characterization of degradation products, from large aggregates to small molecule fragments, critical for assessing biomaterial safety and performance.
Table 1: Core Analytical Parameters of the Triad
| Technique | Separation/Detection Principle | Key Metrics for Degradation Analysis | Typical Analysis Time |
|---|---|---|---|
| SEC | Hydrodynamic Volume (Size) | Molecular Weight Distribution (Mw, Mn), Polydispersity Index (Ð), % Aggregate, % Fragment | 20-40 min |
| HPLC | Chemical Affinity (Polarity, Charge) | Retention Time Shift, Peak Area % of New Species, Purity % | 15-60 min |
| NMR | Nuclear Spin Environment (Structure) | Chemical Shift (δ, ppm), Signal Integration, Impurity Detection Limit (~0.1-1 mol%) | 5-60 min |
Table 2: Quantitative Degradation Product Analysis from a Model Poly(lactic-co-glycolic acid) (PLGA) Study
| Degradation Time (Weeks) | SEC: Mw Reduction (%) | SEC: Low Mw Fragment Peak Area (%) | HPLC: New Peak Area (%) (Degradants) | 1H NMR: Lactide/Glycolide Ratio Change |
|---|---|---|---|---|
| 0 | 0 (Baseline) | <1% | <0.5% | 50:50 (Baseline) |
| 4 | 15 | 5 | 3.2 | 52:48 |
| 8 | 38 | 18 | 8.7 | 55:45 |
| 12 | 65 | 35 | 22.1 | 58:42 |
Experimental Protocols
Protocol 1: SEC for Molecular Weight Distribution Monitoring
Objective: Quantify changes in average molecular weight and detect fragment/aggregate formation. Materials: SEC system with refractive index (RI) detector; columns: guard + two analytical (e.g., pore sizes 100Å, 1000Å); mobile phase: 0.1M NaNO₃ + 0.02% NaN₃ in HPLC-grade water; PMMA or PEG standards for calibration. Procedure:
- Sample Prep: Dissolve lyophilized degradation supernatant or digested material in mobile phase (2 mg/mL). Filter through 0.22 µm hydrophilic PVDF syringe filter.
- System Equilibration: Flush system with mobile phase at 0.8 mL/min for ≥1 hour.
- Calibration: Inject 100 µL of standard mixture. Construct log(Mw) vs. retention time calibration curve.
- Analysis: Inject 100 µL of sample. Run isocratically for 30 min.
- Data Analysis: Use software to calculate number-average (Mn), weight-average (Mw) molecular weights, and polydispersity (Ð). Integrate peaks outside the main polymer envelope to quantify % aggregate (early eluting) and % fragment (late eluting).
Protocol 2: RP-HPLC for Degradant Profiling
Objective: Resolve and quantify specific low-molecular-weight degradation products. Materials: RP-HPLC system with PDA/UV detector; C18 column (250 x 4.6 mm, 5 µm); Mobile Phase A: 0.1% Trifluoroacetic acid (TFA) in water; B: 0.1% TFA in acetonitrile. Procedure:
- Sample Prep: Centrifuge degradation medium at 10,000xg for 10 min. Dilute supernatant 1:5 with Mobile Phase A. Filter (0.22 µm).
- Gradient Elution:
- 0-5 min: 5% B (hold)
- 5-30 min: 5% → 95% B (linear gradient)
- 30-35 min: 95% B (hold)
- 35-36 min: 95% → 5% B
- 36-45 min: 5% B (re-equilibration)
- Detection: Monitor at 210 nm and 254 nm. Flow rate: 1.0 mL/min. Injection volume: 50 µL.
- Quantification: Identify new peaks relative to time-zero control. Report as relative peak area percentage of total integrated area.
Protocol 3: 1H NMR for Structural Confirmation and Ratio Analysis
Objective: Identify chemical structures of degradants and monitor copolymer composition changes. Materials: High-resolution NMR spectrometer (≥400 MHz); deuterated solvent (e.g., D₂O, CDCl₃); 5 mm NMR tube. Procedure:
- Sample Prep: Lyophilize sample. Redissolve in 600 µL of deuterated solvent. Transfer to NMR tube.
- Acquisition:
- Probe tuning/matching.
- Lock on deuterium signal.
- Shim to optimize field homogeneity.
- Pulse sequence: Standard 1D pulse sequence with water suppression if using D₂O.
- Parameters: 64-128 scans, spectral width 12-16 ppm, relaxation delay (D1) = 2-5 sec.
- Processing & Analysis: Apply Fourier transformation, phase correction, and baseline correction. Reference chemical shift to solvent peak. Integrate characteristic peaks (e.g., lactyl CH at ~5.2 ppm, glycolyl CH₂ at ~4.8 ppm). Calculate molar ratios from integral values.
Visualizations
Analytical Triad Workflow for Degradation Study
Polymer Degradation Pathways & Detectable Products
The Scientist's Toolkit: Essential Research Reagent Solutions
Table 3: Key Materials for SEC-HPLC-NMR Degradation Analysis
| Item | Function in Analysis | Example/Note |
|---|---|---|
| SEC Columns (e.g., TSKgel, Ultrahydrogel) | Separate molecules based on hydrodynamic radius in aqueous/organic phases. | Choose pore size(s) to match polymer Mw range. |
| HPLC Columns (C8/C18) | Resolve degradants by reverse-phase hydrophobic interaction. | Essential for isolating non-polar fragments. |
| Deuterated Solvents (D₂O, CDCl₃) | Provide NMR field lock and signal without interfering proton signals. | Required for high-quality NMR spectra. |
| Molecular Weight Standards | Calibrate SEC for accurate Mw determination. | Polyethylene glycol (PEG), polystyrene (PS) in relevant solvent. |
| 0.22 µm Syringe Filters (PVDF/Nylon) | Remove particulates to protect columns and ensure clear NMR samples. | PVDF for aqueous/organic compatibility. |
| Trifluoroacetic Acid (HPLC Grade) | Ion-pairing agent in mobile phase to improve peak shape of acidic degradants. | Use at low concentration (0.05-0.1%). |
| Deuterated NMR Reference (e.g., TMS) | Provides precise chemical shift reference point (0 ppm). | Added in small quantities for CDCl₃; not for D₂O. |
| Enzymes (for controlled degradation) | Mimic in vivo degradation pathways (e.g., Lysosome, Proteinase K). | Used in incubation studies prior to analysis. |
Quantifying biomaterial degradation products is a critical nexus for both R&D innovation and regulatory compliance. Within the framework of SEC-HPLC-NMR research, precise objectives are paramount. This application note details what to quantify, the rationale behind these choices, and standardized protocols to ensure data integrity for regulatory submissions and R&D decision-making.
Critical Quantifiable Targets in Biomaterial Degradation
For regulatory (FDA, EMA) and R&D success, quantification must focus on specific, actionable outputs. The table below summarizes the primary targets.
Table 1: Essential Quantification Targets for Biomaterial Degradation Studies
| Target | Analytical Technique(s) of Choice | R&D Rationale | Regulatory Rationale |
|---|---|---|---|
| Molecular Weight Distribution | SEC-HPLC with MALS/RI | Determines polymer chain scission rate; correlates degradation kinetics with material performance. | Required for demonstrating batch-to-batch consistency and structural integrity per ICH Q6B. |
| Specific Degradant Identification & Concentration | HPLC-NMR, LC-MS | Identifies toxic or bioactive leachables (e.g., monomers, catalysts, plasticizers). | ICH Q3B(R2) mandates identification and quantification of degradants > reporting threshold. |
| Degradation Kinetics (Rate Constants) | SEC-HPLC time-point studies | Enables predictive modeling of product lifespan and functional longevity. | Supports justification of shelf-life and in-vivo performance claims. |
| Total Organic Carbon (TOC) / Mass Loss | Gravimetric Analysis, TOC Analyzer | Measures bulk degradation extent; links to physical property changes. | Provides evidence of complete degradation for absorbable/implantable devices (ISO 10993-13). |
| Low Molecular Weight Oligomer Profile | SEC with advanced detection | Crucial for understanding early-stage degradation mechanisms and biocompatibility. | Key safety metric, as LMW oligomers may elicit inflammatory responses. |
Detailed Experimental Protocols
Protocol 1: SEC-HPLC for Molecular Weight Distribution Tracking
Objective: To quantify changes in number-average (Mn) and weight-average (Mw) molecular weight over time during hydrolytic degradation. Materials: See "Scientist's Toolkit" below. Procedure:
- Sample Preparation: Immerse biomaterial (e.g., PLGA film) in phosphate-buffered saline (PBS, pH 7.4) at 37°C. Retrieve triplicate samples at predetermined time points (e.g., 1, 4, 12 weeks).
- Polymer Extraction: Lyophilize retrieved samples, dissolve in SEC mobile phase (e.g., HPLC-grade THF with 0.1% BHT for PLGA) at 2 mg/mL, and filter (0.2 µm PTFE).
- SEC-HPLC Analysis:
- Column: Two Phenogel 5µm linear mixed-bed columns in series.
- Detectors: Refractive Index (RI) and Multi-Angle Light Scattering (MALS).
- Flow Rate: 1.0 mL/min.
- Injection Volume: 100 µL.
- Calibration: Use narrow dispersity polystyrene standards.
- Data Analysis: Use instrument software to calculate Mn, Mw, and dispersity (Đ). Plot Mn/Mw vs. time to determine degradation rate.
Protocol 2: HPLC-NMR for Degradant Identification and Quantification
Objective: To isolate, identify, and quantify specific low-molecular-weight degradation products. Procedure:
- Degradant Collection: Subject aged biomaterial eluate to preparatory HPLC using a C18 column. Collect fraction peaks of interest based on UV/RI chromatograms.
- NMR Sample Preparation: Lyophilize collected fractions. Redissolve in 600 µL of deuterated solvent (e.g., DMSO-d6). Transfer to a 5 mm NMR tube.
- NMR Analysis:
- Employ a 600 MHz NMR spectrometer with a cryoprobe.
- Run standard 1H NMR pulse sequence with water suppression.
- For quantification, add a known concentration of an internal standard (e.g., 1,3,5-trioxane) prior to lyophilization.
- Identification & Quantification: Compare chemical shifts and coupling patterns to pure compound databases. Use integral ratio of target degradant peak to internal standard peak for concentration calculation.
Visualizing the Workflow and Decision Logic
Diagram 1: Integrated Workflow for Degradation Quantification
Diagram 2: Objective-Driven Selection of Quantification Methods
The Scientist's Toolkit: Key Research Reagent Solutions
Table 2: Essential Materials for SEC-HPLC-NMR Degradation Studies
| Item | Function / Rationale | Example Product/Catalog |
|---|---|---|
| SEC Columns (Mixed Bed) | Separates polymer chains by hydrodynamic volume for accurate MW distribution. | Agilent PLgel MIXED-C, 5µm, 300 x 7.5 mm. |
| MALS Detector | Provides absolute molecular weight measurement without reliance on standards. | Wyatt Technology miniDAWN TREOS. |
| Deuterated NMR Solvents | Allows lock and shimming in NMR without introducing extraneous proton signals. | DMSO-d6, Deuterium Oxide (D2O). |
| HPLC-NMR Interface | Enables direct fraction transfer from HPLC to NMR flow probe, preserving labile degradants. | Bruker LC-NMR Probehead (e.g., 30 µL flow cell). |
| NMR Internal Standard | Provides a known reference peak for quantitative 1H NMR. | 1,3,5-Trioxane, Sodium Trimethylsilylpropanesulfonate (DSS). |
| Simulated Body Fluid (SBF) | Provides physiologically relevant ion concentration for in-vitro degradation studies. | Prepared per Kokubo et al. protocol. |
| 0.2 µm PTFE Syringe Filters | Removes particulates that could damage SEC columns or clog HPLC-NMR lines. | Millex-LG, 13 mm diameter. |
| Narrow Dispersity Polystyrene Standards | Calibrates and validates SEC system performance. | Agilent EasiVial PS-H Series. |
Step-by-Step Method Development: SEC, HPLC, and NMR Protocols for Degradation Analysis
Within a broader thesis utilizing Size-Exclusion Chromatography (SEC) coupled with HPLC and NMR for quantifying biomaterial degradation products, precise SEC method design is foundational. Accurate molar mass distribution (MMD) analysis is critical for characterizing intact polymers and their enzymatic or hydrolytic breakdown fragments. This protocol details the optimization of core SEC parameters—column selection, mobile phase composition, and calibration—to ensure reproducible, high-resolution separations that provide reliable molar mass data for downstream NMR structural analysis.
Column Selection Strategy for Biomaterial Analysis
Column selection is dictated by the pore size distribution of the packed stationary phase, which defines the separation range. For degrading biomaterials (e.g., poly(lactic-co-glycolic acid) (PLGA), polysaccharides, proteins), a column series or a mixed-bed column is often required to cover the broad molar mass range from intact polymer to small oligomers.
Table 1: Common SEC Columns for Biomaterial Analysis
| Column Type | Pore Size Range (Å) | Molar Mass Range (Da) | Ideal Application in Degradation Studies |
|---|---|---|---|
| Large Pore | 1000-5000 | 50,000 - 5,000,000 | Initial intact polymer characterization. |
| Intermediate Pore | 200-500 | 5,000 - 500,000 | Primary degradation products, large fragments. |
| Small Pore | 50-150 | 100 - 50,000 | Small oligomers and near-monomer fragments. |
| Mixed-Bed | Mixed | 100 - 5,000,000+ | Screening unknown degradation profiles. |
Protocol 2.1: Column Screening and Series Configuration
- Reconstitute samples in the intended mobile phase at 2-5 mg/mL.
- Initially inject onto a mixed-bed column for a broad overview of the MMD.
- Based on elution volumes, select 2-3 columns with complementary pore sizes to create a series.
- Connect columns in order of decreasing pore size (e.g., Large → Intermediate → Small) using zero-dead-volume fittings.
- Validate the series using a broad molar mass standard; the log(M) vs. Ve (elution volume) plot should be linear across the range of interest.
Mobile Phase Optimization
The mobile phase must dissolve analytes, suppress unwanted interactions with the stationary phase, and be compatible with downstream detectors (UV, RI, NMR). For biomaterials, ionic strength and pH are critical.
Table 2: Common SEC Mobile Phases for Biomaterials
| Mobile Phase | Typical Composition | Key Additives & Rationale | Compatible Biomaterials |
|---|---|---|---|
| Aqueous Buffer | 50-100 mM Na₂SO₄, NaNO₃, or NH₄OAc in H₂O | 0.02-0.05% NaN₃ (bacteriostat). Adjust pH to 6-8 to minimize column/sample charges. | Proteins, polysaccharides (dextran, chitosan), PEG. |
| Organic | HPLC-grade THF, DMF, or CHCl₃ | 0.1% Triethylamine (TEA) as a tailing reducer in CHCl₃. | PLGA, PLA, PCL, polystyrene. |
| Aqueous-Organic | 30-70% Acetonitrile in aqueous buffer | Modulate polarity to dissolve complex degradation mixtures. | Some polyesters, functionalized polymers. |
Protocol 3.1: Mobile Phase Preparation and Column Equilibration
- Prepare 2L of mobile phase by dissolving the appropriate salt in ultrapure water (≥18 MΩ·cm). Filter through a 0.22 µm membrane filter and degas for 20 minutes via sonication.
- For organic phases, use stabilizer-free THF. Add stabilizers (e.g., BHT) can interfere with NMR analysis.
- Equilibrate the SEC system at a low flow rate (0.2 mL/min) for at least 30 minutes, then at the method flow rate (typically 0.5-1.0 mL/min for analytical columns) for 90 minutes until a stable baseline is achieved.
- Verify equilibration by injecting a pure solvent blank; there should be no significant system peak.
Calibration for Accurate Molar Mass Distribution
Absolute molar mass requires multi-angle light scattering (MALS) detection. For conventional calibration using narrow standards, careful selection and data fitting are essential.
Table 3: Calibration Standards and Parameters
| Standard Type | Example Materials | Dispersity (Đ) Requirement | Calibration Model |
|---|---|---|---|
| Narrow Polymers | Polymethylmethacrylate (PMMA in THF), Pullulan/PEG (aqueous) | Đ < 1.1 | 3rd- or 5th-order polynomial fit of log(M) vs. Ve. |
| Protein Standards | Thyroglobulin, BSA, Ribonuclease A | Đ ~ 1.0 | Used for verifying aqueous column performance. |
| Broad Polymer | Polystyrene (various solvents) | Đ > 1.5 | Used for "Q-factor" or universal calibration with Mark-Houwink parameters. |
Protocol 4.1: Construction of a Calibration Curve
- Prepare individual solutions of at least 10 narrow standards, spanning the full separation range of the column set (1 mg/mL in mobile phase).
- Inject each standard in triplicate under identical SEC conditions. Record the peak apex elution volume (Ve).
- Average the Ve for each standard. Plot log10(Molar Mass) versus Ve.
- Apply a polynomial fit (degree 3 or 5) to the data. The coefficient of determination (R²) should be >0.99.
- Validate the curve with a secondary standard not used in the calibration set. The calculated molar mass should be within ±5% of the certified value.
Integrated Experimental Workflow
The following diagram outlines the logical workflow for SEC method development within the thesis framework.
Title: SEC Method Development and Analysis Workflow for Biomaterial Degradation
The Scientist's Toolkit: Essential Research Reagents & Materials
Table 4: Key Reagent Solutions and Materials
| Item | Function in SEC Method Development |
|---|---|
| Narrow Dispersity Polymer Standards | To construct the calibration curve linking elution volume to molar mass. |
| HPLC-Grade Solvents (THF, DMF, Buffer Salts) | To ensure minimal UV/RI background noise and prevent column contamination. |
| 0.22 µm Membrane Filters (Nylon/PTFE) | For filtering mobile phase and all sample solutions to protect columns. |
| Size-Exclusion Columns | The core stationary phase that separates molecules based on hydrodynamic volume. |
| Refractive Index (RI) Detector | Universal concentration detector for polymers lacking a UV chromophore. |
| Online Degasser | Removes dissolved gases from the mobile phase to prevent baseline instability. |
| Fraction Collector | For collecting discrete elution volumes for subsequent offline NMR analysis. |
| D₂O or deuterated solvents (CDCl₃, d₆-DMSO) | For preparing NMR-compatible SEC fractions to enable direct structural analysis. |
Abstract Within a thesis investigating Size Exclusion Chromatography (SEC) coupled with HPLC-NMR for characterizing biomaterial degradation products, orthogonal analytical methods are required for precise separation and quantification of small polar metabolites, oligomers, and residual monomers. This application note details the development of complementary reversed-phase (RP) and hydrophilic interaction liquid chromatography (HILIC) methods, paired with optimal detection strategies (UV, RID, CAD), to address the full spectrum of analytes. Protocols for method selection, optimization, and cross-validation are provided.
The degradation profile of polymeric biomaterials often contains a complex mixture spanning hydrophobic to highly hydrophilic compounds. While SEC-HPLC-NMR excels in macromolecular characterization and structural elucidation, it has limitations in resolving small, polar molecules and providing robust quantification. This work integrates RP-HPLC for mid-to-non-polar analytes (e.g., certain plasticizers, aromatic monomers) and HILIC-HPLC for polar, non-charged analytes (e.g., glycolic acid, lactic acid, sugars) that are poorly retained in RP. The selection of a universal (CAD, RID) versus selective (UV) detector is critical for comprehensive analysis.
Mode and Detector Selection: Comparative Data
Table 1: Comparison of HPLC Modes for Degradation Product Analysis
| Parameter | Reversed-Phase (RP) | HILIC |
|---|---|---|
| Stationary Phase | C18, C8, phenyl-hexyl | Bare silica, amino, amide, zwitterionic |
| Mobile Phase | Aqueous buffer + organic (ACN, MeOH) | High organic (~60-95% ACN) + aqueous buffer (~5-40%) |
| Analyte Suitability | Medium to non-polar; hydrophobic molecules | Polar and hydrophilic; acids, sugars, small oligomers |
| Elution Order | Polar first, hydrophobic last | Hydrophobic first, polar last |
| Compatibility with SEC-NMR Sample Set | Excellent for residual monomers, hydrophobic additives | Essential for polar degradation fragments (e.g., from PGA, PLA) |
Table 2: Detector Comparison for Quantification
| Detector | Principle | Advantages | Limitations | LOD/LOQ Range (Typical) |
|---|---|---|---|---|
| UV/Vis | Absorbance of UV light | Selective, robust, high sensitivity for chromophores | Requires UV chromophore; non-universal | pg-ng (compound-dependent) |
| RID | Refractive index change | Universal for organics; simple operation | Low sensitivity; temperature sensitive; no gradient | ~1 µg |
| CAD | Charged aerosol detection | Near-universal response; high sensitivity vs. RID; gradient compatible | Non-linear at high concentrations; volatile buffers incompatible | Low ng |
Experimental Protocols
Protocol 3.1: Screening for Optimal Chromatographic Mode
Objective: To determine whether RP or HILIC provides superior separation for a given degradation product mixture. Materials:
- HPLC System: Binary pump, autosampler, column oven, and detector (CAD or UV recommended for screening).
- Columns: RP (e.g., C18, 150 x 4.6 mm, 2.7 µm) and HILIC (e.g., bare silica or amide, 150 x 4.6 mm, 3 µm).
- Samples: Degradation mixture dissolved in appropriate solvent (e.g., water for HILIC, water/ACN for RP).
- Mobile Phases: (A) 10 mM ammonium formate in water, pH 3; (B) Acetonitrile.
Procedure:
- RP Condition Screening: Inject sample. Run a gradient from 5% B to 95% B over 20 min. Hold at 95% B for 5 min. Equilibrate.
- HILIC Condition Screening: Inject sample. Run a gradient from 95% B to 60% B over 20 min. Hold at 60% B for 5 min. Equilibrate at 95% B for 10 min.
- Analysis: Compare chromatograms for peak distribution, resolution (Rs > 1.5), and peak shape (asymmetry factor 0.8-1.5). Select the mode yielding the most evenly distributed and well-resolved peaks for the target analytes.
Protocol 3.2: Quantification of Lactic Acid using HILIC-CAD
Objective: Precisely quantify a key polar degradation product of polylactic acid (PLA) biomaterials. Materials: As in 3.1, with amide HILIC column and Charged Aerosol Detector (CAD).
Detailed Method:
- Column: Amide-bonded HILIC (150 x 4.6 mm, 3 µm). Temperature: 30°C.
- Mobile Phase: (A) 10 mM ammonium formate in water, pH 3.0, (B) Acetonitrile. Isocratic: 15% A / 85% B.
- Flow Rate: 0.8 mL/min. Injection Volume: 10 µL.
- CAD Parameters: Nebulizer Temp: 30°C. Data Collection Rate: 10 Hz. Filter: 3.6 s.
- Calibration: Prepare lactic acid standards in the range of 0.5 µg/mL to 100 µg/mL in 85% ACN/15% water. Inject in triplicate.
- Data Analysis: Plot peak area (y) vs. concentration (x). CAD response follows a power function (y = a*x^b). Use a quadratic or power fit for the calibration curve. Apply the fit to quantify unknown samples.
Visualization of Method Development Workflow
HPLC Mode & Detector Selection Workflow
The Scientist's Toolkit: Essential Research Reagents & Materials
Table 3: Key Reagents and Materials for Method Development
| Item | Function / Role in Development |
|---|---|
| Acetonitrile (HPLC/MS Grade) | Primary organic modifier for both RP (desorbent) and HILIC (weak eluent). Low UV cutoff. |
| Ammonium Formate/Acetate | Volatile buffer salts for mobile phase pH and ionic strength control; compatible with MS and CAD. |
| Formic Acid (LC/MS Grade) | Common acidifier for mobile phases to suppress ionization of acidic analytes (esp. in RP). |
| C18 Column (e.g., 150x4.6mm) | Standard workhorse column for RP separation of medium-low polarity compounds. |
| Amide or Bare Silica HILIC Column | For retention and separation of highly polar, non-charged degradation products. |
| Charged Aerosol Detector (CAD) | Universal mass-sensitive detector for quantification of non-volatile analytes lacking chromophores. |
| Lactic Acid / Glycolic Acid Standards | Reference materials for calibrating methods targeting common polyester degradation products. |
| Polymer Degradation Sample | The real-world test mixture, ideally generated under controlled hydrolytic/oxidative conditions. |
Within the broader thesis investigating SEC-HPLC-NMR techniques for quantifying biomaterial degradation products, the NMR spectroscopy setup is the critical analytical endpoint. This integrated approach size-separates complex degradation mixtures via Size Exclusion Chromatography (SEC), isolates components with HPLC, and structurally characterizes/quantifies them via NMR. This section details the foundational NMR protocols—sample preparation, pulse sequences, and quantitative parameters—essential for generating reliable data on oligomeric and monomeric degradation species in biomaterials research.
Sample Preparation for SEC-HPLC-NMR Analysis
Proper preparation of SEC-HPLC fractions for NMR is paramount for sensitivity and resolution.
Protocol: Post-Chromatography Sample Processing for NMR
Objective: To prepare an SEC-HPLC fraction for high-quality, quantitative NMR analysis. Materials: Collected HPLC fraction (in volatile buffer/organic solvent), lyophilizer or rotary evaporator, high-precision NMR tube (e.g., 5 mm), deuterated solvent (e.g., D₂O, DMSO‑d₆), internal quantitative standard (e.g., DSS, maleic acid). Procedure:
- Solvent Exchange & Drying: Evaporate the HPLC solvent (e.g., acetonitrile, trifluoroacetic acid buffer) using a gentle stream of nitrogen or lyophilization. For aqueous buffers, use lyophilization.
- Reconstitution: Redissolve the dry residue in a precise volume (typically 500-600 µL) of the chosen deuterated solvent. Ensure complete dissolution by gentle vortexing and/or brief sonication.
- Internal Standard Addition: Add a precise, known amount (e.g., 0.1 µmol) of a chemical shift and quantitation standard (e.g., Sodium 2,2-dimethyl-2-silapentane-5-sulfonate, DSS). DSS is preferred for aqueous samples as its methyl singlet does not interfere with most organic signals.
- Tube Loading: Transfer the solution to a clean, high-quality 5 mm NMR tube. Avoid bubbles. Critical Notes: The deuterated solvent provides the lock signal. For biomaterial degradation products, D₂O is common, but DMSO‑d₆ may be needed for less polar oligomers. Sample concentration should be maximized within solubility limits.
The Scientist's Toolkit: Key Research Reagent Solutions
| Item | Function in SEC-HPLC-NMR Workflow |
|---|---|
| D₂O (99.9% D) | Primary deuterated solvent for aqueous samples; provides deuterium lock for NMR stability. |
| DMSO‑d₆ (99.8% D) | Deuterated solvent for less polar or poorly water-soluble degradation products. |
| DSS (D₆, 98%) | Internal chemical shift reference (δ 0.00 ppm) and quantification standard for ¹H NMR in aqueous solutions. |
| Maleic Acid | Alternative quantification standard for ¹H NMR (sharp singlet at δ ~6.3 ppm), especially useful in organic solvents. |
| Chromatography-grade Solvents (ACN, TFA) | Used in the upstream SEC-HPLC mobile phase to achieve separation without interfering NMR signals post-evaporation. |
| 3 mm or 5 mm NMR Tubes | High-precision tubes (e.g., Wilmad 535-PP) to ensure field homogeneity and spectral line shape. |
Pulse Sequences for Structural Elucidation and Quantification
Selection of appropriate pulse sequences is key to extracting structural and quantitative information from often limited-concentration degradation products.
Core 1D and 2D Sequences
- ¹H NMR (One-Dimensional): The primary workhorse for quantification. Use a simple 90° pulse-acquire sequence with sufficient relaxation delay (D1 > 5*T1) for quantitative accuracy.
- ¹³C NMR (DEPT-135): Distinguishes between CH₃/CH (positive signals) and CH₂ (negative signals) carbons, crucial for identifying monomer units in degradation oligomers.
- ¹H-¹H COSY: Identifies scalar-coupled proton networks within a molecule, mapping connectivity through chemical bonds.
- ¹H-¹³C HSQC: Correlates directly bonded protons and carbons (¹JCH), providing a "map" of protonated carbons. Essential for assigning signals in complex mixtures.
- ¹H-¹³C HMBC: Detects long-range correlations (²JCH, ³JCH), establishing connections between protons and carbons over 2-3 bonds. Critical for determining linkages between monomer units in oligomers.
Experimental Protocol: Quantitative ¹H NMR (qHNMR)
Objective: To absolutely quantify the concentration of a target degradation product in an NMR sample. Pulse Sequence: Single-pulse ¹H experiment with presaturation for solvent suppression if needed (e.g., for HOD signal in D₂O). Key Acquisition Parameters:
- Pulse Angle (P1): 90°.
- Relaxation Delay (D1): ≥ 25-30 seconds (must be >5x the longest T1 of quantified signals; determined via inversion recovery).
- Number of Scans (NS): 64-256, depending on concentration.
- Spectral Width (SW): 20 ppm.
- Acquisition Time (AQ): ~4 seconds. Processing & Quantification:
- Process FID with exponential multiplication (LB=0.3 Hz), Fourier transformation, and phase correction.
- Reference spectrum to internal standard (DSS, δ 0.00 ppm).
- Integrate signal areas for the target analyte resonance (Ianalyte) and the internal standard resonance (Istd).
- Calculate analyte concentration: Canalyte = (Ianalyte / Nanalyte) * (Nstd / Istd) * Cstd Where N = number of protons giving rise to the integrated signal, and C_std is the known molar concentration of the standard.
Quantitative ¹H/¹³C NMR Parameters
Accurate quantification and interpretation rely on optimized acquisition parameters.
Table 1: Key Quantitative NMR Acquisition Parameters for ¹H and ¹³C NMR
| Parameter | Quantitative ¹H NMR | Quantitative ¹³C NMR (with Inverse-Gated Decoupling) | Purpose/Rationale |
|---|---|---|---|
| Pulse Angle | 90° (π/2) | 30°-45° (Ernst angle) or 90° with long D1 | Maximizes signal while allowing for complete relaxation between scans. |
| Relaxation Delay (D1) | ≥ 5 * T1 (longest) | ≥ 5 * T1(¹³C) (often 30-60 sec) | Ensures ~99% relaxation of nuclei between scans for accurate integration. |
| Number of Scans (NS) | 16-256 | 512-4096 | Achieves necessary signal-to-noise ratio (SNR). |
| Decoupling | Not applicable | Inverse-gated ¹H decoupling (WALTZ16) ON only during acquisition | Decouples ¹H-¹³C splitting for sharper singlet ¹³C signals, but leaves NOE enhancement suppressed to allow quantitative integration. |
Quantitative Data from Biomaterial Degradation Studies
Table 2: Example Quantitative NMR Data for Poly(Lactic-co-Glycolic Acid) (PLGA) Hydrolysis Products (Hypothetical Data)
| Identified Degradation Product | ¹H NMR Signal (δ, ppm) | ¹³C NMR Signal (δ, ppm) | Quantitative Ratio (vs. DSS) | Concentration (µM) in Fraction |
|---|---|---|---|---|
| Lactic Acid (monomer) | 1.33 (d, J=6.8 Hz, 3H) | 20.5 (CH₃), 69.2 (CH), 178.0 (C=O) | 0.45 | 45.0 |
| Glycolic Acid (monomer) | 4.01 (s, 2H) | 61.0 (CH₂), 176.5 (C=O) | 0.22 | 22.0 |
| Lactyl-Lactate (dimer) | 1.35 (d, J=6.9 Hz, 6H), 5.15 (q, J=6.9 Hz, 1H) | 20.6, 69.5, 169.8 (ester C=O) | 0.08 | 8.0 |
| DSS (Internal Std) | 0.00 (s, 9H) | - | 1.00 | 100.0 (added) |
Workflow and Logical Diagrams
NMR Workflow for Biomaterial Degradation Analysis
Pulse Sequence Selection Logic Tree
Application Notes
Within a research thesis focused on quantifying biomaterial degradation products, the integration of Size Exclusion Chromatography (SEC), High-Performance Liquid Chromatography (HPLC), and Nuclear Magnetic Resonance (NMR) spectroscopy presents a transformative analytical workflow. This orthogonal approach enables the separation, quantification, and structural elucidation of complex mixtures, such as polymeric drug delivery system degradants or protein aggregate profiles, in a single, streamlined process.
The primary application is the comprehensive characterization of complex biomaterial formulations and their breakdown products. SEC provides an initial gentle separation based on hydrodynamic volume, preserving non-covalent aggregates and separating them from monomers and smaller degradants. Subsequent online HPLC (e.g., reversed-phase) further resolves components by hydrophobicity. Finally, online or stopped-flow NMR delivers unparalleled structural information, identifying chemical modifications, quantifying components, and confirming degradation pathways. This workflow is critical for regulatory filings in drug development, requiring exhaustive product understanding.
Key Experimental Protocol: SEC-HPLC-NMR Analysis of Polylactide-co-glycolide (PLGA) Nanoparticle Degradation Products
- Objective: To separate, quantify, and identify the hydrolytic degradation products of PLGA-based nanoparticles.
- Sample Preparation: Incubate PLGA nanoparticles in phosphate-buffered saline (pH 7.4) at 37°C for predetermined intervals (e.g., 1, 7, 30 days). Quench the reaction, filter (0.22 µm), and lyophilize. Reconstitute in the SEC mobile phase.
- Instrument Configuration: The systems are connected in series via a capillary interface with a sample loop or a stopped-flow valve.
- SEC Separation:
- Column: Two serially connected SEC columns (e.g., 300 x 7.8 mm) with appropriate pore sizes (e.g., 100 and 500 Å).
- Mobile Phase: 50 mM ammonium acetate in HPLC-grade water, pH 6.8. Isocratic elution.
- Flow Rate: 0.5 mL/min.
- Detection: UV at 210 nm and 254 nm.
- Injection Volume: 100 µL of 5 mg/mL sample.
- HPLC Fractionation/Transfer:
- Based on SEC-UV chromatogram, target peaks (e.g., high molecular weight aggregates, oligomeric fraction, monomeric fraction) are automatically transferred via a switching valve to a trapping column or directed to the NMR flow cell.
- For further resolution, a reversed-phase C18 trap column can be used to desalt and concentrate the SEC fraction before NMR analysis.
- NMR Analysis:
- Mode: Stopped-flow for optimal signal-to-noise.
- Probe: 600 MHz spectrometer fitted with a cryogenically cooled 3 mm inverse detection flow probe.
- Experiment: 1D ¹H NMR with water suppression (e.g., pre-saturation). For critical fractions, 2D experiments (¹H-¹³C HSQC, ¹H-¹H COSY) may be performed.
- Acquisition: 128 scans, 4s relaxation delay, 25°C.
- SEC Separation:
Data Presentation
Table 1: Quantification of PLGA Degradation Products Over Time via Integrated SEC-HPLC-NMR
| Degradation Time (Days) | High MW Aggregate (%)* | Oligomeric Fraction (%)* | Lactide Monomer (mM) | Glycolide Monomer (mM) | Unknown Degradant (Identified via NMR) |
|---|---|---|---|---|---|
| 1 | 98.5 | 1.2 | 0.05 | 0.02 | Not Detected |
| 7 | 85.1 | 13.5 | 0.45 | 0.31 | Trace Succinate |
| 30 | 22.4 | 65.3 | 12.8 | 8.9 | Acetic Acid, Succinate |
Percentage of total peak area from SEC-UV chromatogram at 210 nm. *Concentration calculated via ¹H NMR qNMR using maleic acid as an internal standard.
Visualization
Diagram Title: Integrated SEC-HPLC-NMR Workflow for Biomaterial Analysis
Diagram Title: Role of Integrated Workflow in Degradation Research Thesis
The Scientist's Toolkit: Key Research Reagent Solutions
| Item | Function in SEC-HPLC-NMR Workflow |
|---|---|
| SEC Columns (e.g., with silica or polymer matrix) | Provide gentle separation based on size; critical for preserving non-covalent aggregates in biomaterials. |
| Ammonium Acetate (HPLC-MS Grade) | A volatile salt for SEC mobile phase, compatible with both HPLC and NMR, and easily removed for downstream MS coupling. |
| Deuterated Solvent with Internal Standard (e.g., D₂O with TSP) | Serves as the NMR lock solvent and provides a reference for chemical shift (δ) and quantitative concentration (qNMR). |
| Reversed-Phase Trap Cartridge (C8/C18) | Desalts and concentrates SEC fractions prior to NMR, removing interfering salts and improving NMR spectral quality. |
| Cryogenically Cooled NMR Flow Probe | Dramatically increases sensitivity for ¹H and heteronuclear detection, enabling analysis of low-concentration degradants. |
| Automated Liquid Handler / Valve System | Precisely transfers chromatographic peaks from the SEC/HPLC to the NMR, ensuring reproducibility and automation. |
Solving Common Analytical Challenges: Troubleshooting SEC, HPLC, and NMR in Degradation Studies
Within a thesis investigating SEC-HPLC-NMR techniques for quantifying biomaterial degradation products, understanding and mitigating common Size Exclusion Chromatography pitfalls is paramount. Adsorption of analytes to the stationary phase, aggregation phenomena, and solvent incompatibility can severely skew molecular weight distributions, leading to inaccurate quantification of degradation fragments. These artifacts are particularly detrimental when characterizing sensitive biomaterials like polymeric scaffolds or protein conjugates, where the accurate size profiling of breakdown products dictates functional and safety assessments. This application note details protocols to diagnose and resolve these core issues, ensuring data fidelity for downstream NMR analysis and quantification.
Pitfall: Non-Size Exclusion Interactions (Adsorption)
Mechanism & Diagnosis
Adsorption occurs when analytes interact with the column packing material via hydrophobic, ionic, or affinity mechanisms, causing delayed elution that mimics a smaller size. This is diagnosed by a recovery of <95% of the injected sample or by the elution of a broad peak after the total column volume.
Table 1: Diagnostic Tests for Adsorption
| Test | Protocol | Expected Result (No Adsorption) | Indicative of Adsorption |
|---|---|---|---|
| Mass Recovery | Inject known concentration, integrate peak area, compare to standard bypassing column. | Recovery 95-105% | Recovery <95% |
| Elution Volume | Inject a small, non-interacting tracer (e.g., acetone). Inject analyte. | Analyte elutes before total volume (Vt). | Analyte elutes at or after Vt. |
| Mobile Phase Modifier | Run in standard buffer vs. buffer with 200 mM NaCl or 5% organic solvent. | Identical elution volumes. | Shift in elution volume with modifier. |
Protocol: Mitigating Adsorption via Mobile Phase Optimization
Objective: To eliminate non-size exclusion interactions for a poly(lactic-co-glycolic acid) (PLGA) degradation product mixture. Materials: SEC column (e.g., Agilent PL aquagel-OH Mixed-H), HPLC system, PLGA oligomers, ammonium acetate buffer (pH 6.8), acetic acid, acetonitrile. Procedure:
- Prepare mobile phase A: 100 mM ammonium acetate in HPLC-grade water, pH adjusted to 6.8 with acetic acid.
- Prepare mobile phase B: 80:20 (v/v) acetonitrile to Mobile Phase A.
- Equilibrate the SEC column with Mobile Phase A at 1 mL/min for 30 minutes.
- Inject sample dissolved in Mobile Phase A. Observe elution profile and recovery.
- If adsorption is suspected (low recovery), switch to Mobile Phase B. Re-equilibrate column for 60 minutes.
- Re-inject the same sample dissolved in Mobile Phase B. The organic modifier disrupts hydrophobic adsorption.
- Critical: After run, re-equilibrate column thoroughly with storage solvent as per manufacturer's instructions.
Pitfall: Sample & Solvent-Induced Aggregation
Mechanism & Diagnosis
Aggregation causes early elution, misinterpreted as a high molecular weight product. It is often induced by mismatches between sample solvent and mobile phase (ionic strength, pH, organic content).
Table 2: Conditions Leading to On-Column Aggregation
| Factor | Aggregation Risk Condition | Preventive Condition |
|---|---|---|
| Solvent Ionic Strength | Sample solvent ionic strength << mobile phase. | Match or slightly lower ionic strength in sample. |
| Organic Solvent Content | Sample solvent has high organic %; mobile phase is aqueous. | Dialyze sample into mobile phase or use matched solvent. |
| pH Difference | Sample pH differs from mobile phase by >1 unit. | Adjust sample pH to match mobile phase precisely. |
| Concentration | Sample concentration > 5 mg/mL for most proteins/polymers. | Use loading concentration ≤ 2 mg/mL. |
Protocol: Sample Preparation to Prevent Aggregation
Objective: To prepare a protein-biomaterial conjugate degradation sample for SEC-HPLC-NMR analysis without inducing aggregation. Materials: Centrifugal filters (10kDa MWCO), dialysis tubing, mobile phase (50 mM phosphate, 150 mM NaCl, pH 7.2), vortex mixer. Procedure:
- Initial Desalting: Place the degradation product mixture in a centrifugal filter device compatible with aqueous solutions. Centrifuge at 14,000 x g for 10 minutes.
- Buffer Exchange: Discard the flow-through. Resuspend the retentate with 500 µL of the SEC mobile phase. Vortex gently. Repeat centrifugation. Perform this buffer exchange step a total of three times.
- Final Reconstitution: After the final spin, recover the retentate. Invert the filter and centrifuge at 1,000 x g for 2 minutes to recover the sample.
- Clarification: Centrifuge the final sample solution at 16,000 x g for 5 minutes to remove any pre-formed aggregates or particulates.
- Loading: Carefully pipette the supernatant, avoiding the pellet, into an HPLC vial. The sample solvent is now perfectly matched to the mobile phase.
Pitfall: Solvent Compatibility
Mechanism & Diagnosis
Incompatibility between the column storage solvent, mobile phase, and sample solvent can cause pressure spikes, silica collapse (for silica-based columns), or polymeric stationary phase shrinkage/expansion, degrading column performance.
Table 3: Solvent Compatibility Guide for Common SEC Columns
| Column Type | Compatible Solvents | Incompatible Solvents | Maximum Pressure |
|---|---|---|---|
| Silica-Based | Aqueous buffers, DMF, DMSO (check pH <8). | THF, Chloroform, Toluene (dissolves bonding). | 200 bar |
| Polymer-Based (PS-DVB) | THF, Chloroform, DMF, Toluene. | Water, Alcohols (causes shrinkage). | 150 bar |
| Polymer-Based (OH-based) | Water, Buffers, DMF, DMSO. | THF, Chloroform, Toluene. | 150 bar |
Protocol: Column Transition and Equilibration
Objective: Safely transition a polymeric SEC column from an aqueous storage buffer to a deuterated organic mobile phase for direct hyphenation to NMR. Materials: Polymer-based SEC column (e.g., Tosoh TSKgel), HPLC pump, pressure monitor, mobile phase (deuterated DMF for NMR compatibility). Procedure:
- Initial Flush: Connect the column to the HPLC system with standard unions. Do not connect to the detector yet.
- Stepwise Solvent Change: At a flow rate of 0.2 mL/min, sequentially flush with the following series, monitoring pressure constantly:
- Deionized water (if stored in buffer): 10 column volumes (CV).
- Methanol: 10 CV.
- Acetone: 10 CV.
- Deuterated DMF: 15-20 CV until pressure stabilizes.
- Final Equilibration: Connect the column to the detector. Flow deuterated DMF at the analytical flow rate (e.g., 1 mL/min) for at least 30 minutes or until a stable baseline is achieved.
- Verification: Inject a narrow molecular weight distribution standard dissolved in deuterated DMF to check column performance (plate count, asymmetry) in the new solvent.
The Scientist's Toolkit: Research Reagent Solutions
| Item | Function & Rationale |
|---|---|
| Ultrahydrogel Columns (Waters) | Linear polyacrylamide-based columns for aqueous SEC. Low protein/polymer adsorption due to hydrophilic surface. |
| TSKgel SuperMultiporePW-H Columns (Tosoh) | Polymeric columns with wide pore distribution (100 - 1,000,000 Da). Ideal for screening unknown degradation product mixtures. |
| Agilent PLgel MIXED-E columns | Polydivinylbenzene columns for organic SEC (THF, CHCl3). Excellent for synthetic polymer degradation analysis. |
| Ammonium Acetate (MS Grade) | Volatile salt for LC-MS compatible mobile phases. Eliminates signal suppression and ion source contamination. |
| Sodium Azide (0.02-0.05% w/v) | Preservative for aqueous mobile phases to prevent microbial growth during long NMR acquisition times. Caution: Highly toxic. |
| Deuterated Solvents (D₂O, d⁶-DMSO) | Essential for direct SEC-NMR hyphenation, allowing real-time structural characterization of eluting peaks. |
| Pullulan or Polyethylene Oxide (PEO) Standards | Narrow dispersity standards for calibrating aqueous SEC columns. |
| Polystyrene (PS) Standards | Narrow dispersity standards for calibrating organic SEC columns (e.g., in THF). |
Title: SEC Pitfall Diagnostic Decision Tree
Title: Integrated SEC-HPLC-NMR Workflow for Degradation Products
Application Notes
Within the broader thesis focusing on SEC-HPLC-NMR techniques for the comprehensive analysis of biomaterial degradation products, HPLC optimization is a critical, enabling step. The primary challenge is the quantification of trace-level, structurally similar degradation impurities within complex biological matrices. This necessitates optimizing both chromatographic resolution and detector sensitivity to achieve accurate identification and quantification for subsequent NMR structural elucidation. High-resolution separation reduces peak co-elution, which is essential for both accurate quantitation and for obtaining pure-component NMR spectra. Simultaneously, enhanced sensitivity allows for the detection and analysis of low-abundance degradants, which are often critical for understanding degradation pathways. This application note details key strategies for method development to achieve these goals.
Key Optimization Strategies & Data
Table 1: Impact of Column and Mobile Phase Modifications on Resolution (Rs) and Sensitivity (S/N)
| Optimization Parameter | Condition Tested | Effect on Resolution (Rs) | Effect on Sensitivity (S/N) | Recommended Application |
|---|---|---|---|---|
| Column Particle Size | 5 μm vs. 3 μm vs. sub-2 μm | Rs increases with smaller particles (e.g., from 1.5 to 2.1) | S/N increases due to sharper peaks | High-resolution, high-pressure systems (U/HPLC) |
| Column Temperature | 30°C vs. 40°C vs. 50°C | Can increase Rs by reducing viscosity (e.g., Rs +0.3) | Minor improvement from faster kinetics | Method robustness and efficiency tuning |
| Mobile Phase pH | pH 2.7 vs. pH 3.5 vs. pH 6.8 | Drastic Rs changes for ionizable compounds (ΔRs up to >2.0) | Can affect ionization efficiency in MS | Separation of acidic/basic degradants |
| Gradient Slope | 2%/min vs. 1%/min vs. 0.5%/min | Shallower gradients improve Rs (e.g., Rs from 1.0 to 1.8) | Lower S/N due to broader peaks; requires optimization | Critical pair separation in complex mixtures |
| Flow Cell Path Length | Standard (10 mm) vs. Extended (60 mm) | No direct effect | Direct S/N increase (theoretical 6x gain) | Fluorescence/UV detection of trace analytes |
Table 2: Detector Optimization for Sensitivity Enhancement
| Detector Type | Key Optimization Parameter | Typical Improvement Factor | Compatible with SEC-HPLC-NMR? |
|---|---|---|---|
| UV/Vis DAD | Sampling Rate (Hz), Bandwidth (nm), Path Length (mm) | Up to 10x S/N with extended cell | Yes, non-destructive; primary for quantification |
| Fluorescence (FLD) | Excitation/Emission Wavelength Optimization, PMT Voltage | 10-1000x over UV for native fluorescers | Yes, non-destructive; highly selective |
| Charged Aerosol (CAD) | Evaporation Temperature, Data Rate | 3-5x over UV for non-chromophores | No, destructive; for mass-based quantitation pre-NMR |
| Mass Spectrometry (MS) | Source Temperature, Voltages, Scan Mode (SIM vs. Full Scan) | 10-100x in SIM mode for specific m/z | Yes, with split flow; for identification pre-NMR |
Experimental Protocols
Protocol 1: Systematic Gradient Optimization for Resolution
Objective: To achieve baseline resolution (Rs ≥ 1.5) for all critical peak pairs in a degradation mixture.
- Initial Scouting: Perform a fast, broad gradient (e.g., 5-95% organic in 20 min) to determine the approximate elution window.
- Fine-Tuning: Design a series of segmented gradients focusing on the region where critical pairs co-elute. Use shallower slope segments (0.5-1%/min) in these regions.
- Data Analysis: Calculate Rs for all critical pairs. Use modeling software (e.g., DryLab, ACD Labs) if available to predict optimal conditions.
- Validation: Run the optimized gradient in triplicate to verify reproducibility. Ensure the total run time is acceptable.
Protocol 2: Post-Column Infusion for Sensitivity Limit Assessment in LC-MS
Objective: To distinguish between ionization suppression (matrix effect) and true low analyte response.
- Prepare Solutions: Prepare a standard solution of the target degradant at a known concentration. Prepare a blank matrix sample (e.g., placebo biomaterial extract).
- Infusion Setup: Connect a syringe pump containing the degradant standard to a post-column T-union, introducing it at a constant rate (e.g., 10 μL/min).
- Chromatographic Run: Inject the blank matrix sample and run the optimized HPLC method. The MS signal for the infused degradant should be constant in the absence of matrix effects.
- Analysis: Observe the MS signal trace. A dip or deviation in the steady signal indicates ion suppression/enhancement at that retention time, guiding further sample cleanup or mobile phase modification.
Protocol 3: Method Transfer to SEC-HPLC-NMR Workflow
Objective: To adapt the optimized reversed-phase (RP) HPLC method for use in an online SEC-HPLC-NMR system for non-volatile buffer compatibility.
- Mobile Phase Adjustment: Replace phosphate or other non-volatile buffers with volatile alternatives like ammonium formate or acetate (e.g., 10-50 mM). Adjust pH to mimic original conditions as closely as possible.
- Flow Path Configuration: Install a flow splitter post-detector (UV) to divert ~95-99% of flow to waste or fraction collector, and 1-5% to the MS and NMR, as required.
- NMR Parameter Setup: Set the NMR flow cell temperature to match HPLC column temperature. Predefine shim sets and pulse sequences (e.g., 1D NOESY-presat for water suppression) for stopped-flow or continuous-flow acquisition.
- System Calibration: Inject a test mixture to confirm retention time consistency and ensure NMR sensitivity is sufficient for the diverted flow amount.
The Scientist's Toolkit: Research Reagent Solutions
| Item | Function in HPLC Optimization for Degradation Analysis |
|---|---|
| Sub-2μm C18 U/HPLC Column | Provides high efficiency and resolution for separating complex mixtures of degradants. |
| MS-Grade Volatile Buffers (Ammonium formate/acetate) | Allows seamless coupling of HPLC to MS and preparative collection for NMR without signal interference. |
| Post-Column Infusion Kit (T-union, syringe pump) | Diagnoses matrix effects in biological samples, critical for accurate sensitivity assessment. |
| Extended Path Length UV Flow Cell (e.g., 60 mm) | Enhances sensitivity for UV detection of trace-level degradants without method modification. |
| Fraction Collector (96-well plate) | Enables automated collection of isolated degradant peaks for subsequent offline NMR or bioassay. |
| HPLC Method Modeling Software | Reduces experimental time by simulating the effect of gradient, temperature, and pH changes on resolution. |
Diagrams
Within the framework of a thesis on SEC HPLC NMR techniques for quantifying biomaterial degradation products, three persistent NMR challenges are paramount: managing samples at low concentrations, resolving severe signal overlap, and handling large dynamic range between major and minor species. This document provides application notes and protocols to address these challenges, enabling precise quantification of trace degradation products in polymers, protein aggregates, and pharmaceutical formulations.
Application Notes
Managing Low Concentration Samples
Low concentration analytes, such as trace degradation products, result in poor signal-to-noise (S/N). Advanced techniques are required to enhance sensitivity.
Key Quantitative Data Summary: Table 1: Sensitivity Enhancement Techniques for NMR
| Technique | Principle | Typical S/N Gain Factor | Applicable Nucleus | Key Limitation |
|---|---|---|---|---|
| Cryogenic Probes | Reduces thermal noise | 4-5x | ¹H, ¹³C, ¹⁵N | High cost, requires cryogen |
| Microcoil Probes | Increases filling factor for small volumes | 3-8x (vs. 5mm) | ¹H | Sample volume limited (< 50 µL) |
| Dynamic Nuclear Polarization (DNP) | Transfers electron polarization to nuclei | 10 - 100x | ¹³C, ¹⁵N | Complex setup, requires radicals |
| Non-Uniform Sampling (NUS) | Allows longer indirect dimension evolution | Up to 5x (in time) | All | Reconstruction artifacts possible |
Protocol 1.1: Sample Preparation for Maximum Sensitivity Using a 3 mm CryoProbe Objective: Prepare a low-concentration biomaterial degradation sample for ¹H NMR analysis to maximize S/N. Materials: Lyophilized sample, Deuterated solvent (e.g., D₂O, DMSO-d6), 3 mm NMR tube, Micro-syringe. Procedure:
- Precisely weigh lyophilized sample to obtain 10-50 µg.
- Dissolve in a minimum volume of appropriate deuterated solvent (e.g., 40 µL) to achieve a concentration of 0.2-1 mM in a total volume of ~150 µL.
- Using a micro-syringe, transfer the entire sample solution to a 3 mm NMR tube, ensuring no air bubbles.
- Cap the tube and insert into the NMR spectrometer equipped with a 3 mm triple-resonance cryogenic probe.
- Set probe temperature to 280-300 K.
- Acquire data with extended scans (1024-8192) and optimized pulse angles (e.g., 90° pulse).
Resolving Signal Overlap
Complex mixtures of degradation products lead to crowded spectra. Separation and multidimensional techniques are critical.
Key Quantitative Data Summary: Table 2: Techniques for Resolving Signal Overlap
| Technique | Dimension | Typical Resolution Gain | Experiment Time | Best for Separating... |
|---|---|---|---|---|
| SEC-HPLC-NMR (On-flow) | Chromatography + ¹H | High (Chrom. dimension) | ~30-60 min/run | Species by molecular weight |
| 2D ¹H-¹³C HSQC | ¹H & ¹³C chemical shift | Very High | 30 min - 4 hrs | Overlapped ¹H signals via ¹³C dispersion |
| 2D ¹H-¹H TOCSY | Scalar-coupled ¹H network | High | 15 min - 2 hrs | Signals within a spin system |
| Pure Shift NMR | Collapses ¹H multiplet structure | Moderate (in ¹H dimension) | 5 min - 1 hr | Overlapped multiplets |
Protocol 2.1: SEC-HPLC-NMR for Degradation Product Analysis Objective: Separate and acquire NMR spectra of individual components in a degrading polymer mixture. Materials: HPLC system, SEC column (e.g., 7.8 x 300 mm, 5 µm), Deuterated mobile phase (e.g., D₂O with 50 mM phosphate buffer), Stop-flow interface, 600 MHz NMR with LC probe. Procedure:
- Connect the HPLC system to the NMR flow probe via capillary tubing.
- Condition the SEC column with deuterated mobile phase at 0.5 mL/min until stable.
- Inject 50-100 µL of filtered sample solution (10-20 mg/mL).
- Run isocratic elution with deuterated mobile phase.
- Use "Stop-flow" mode: Monitor the chromatographic UV trace. When a peak of interest reaches the NMR flow cell (typically a 60-120 µL volume), pause the pump.
- Lock, shim, and tune the NMR on the stopped flow.
- Acquire a 1D ¹H NMR or a rapid 2D (e.g., ¹H-¹³C HSQC) spectrum.
- Restart the pump to elute the next peak and repeat steps 5-7.
Managing Dynamic Range
The dynamic range problem arises when quantifying a trace degradation product (<0.1%) in the presence of a dominant parent compound signal.
Key Quantitative Data Summary: Table 3: Approaches for Dynamic Range Management
| Approach | Method | Dynamic Range Improvement | Comment |
|---|---|---|---|
| Signal Saturation | Presaturation of Solvent/Matrix | 10² - 10³ fold (for solvent) | Can saturate nearby analyte signals |
| Relaxation Filtering | T₁ or T₂ filters | Selective (depends on T₁/T₂) | Suppresses signals with long T₁/short T₂ |
| Diffusion Filtering | Diffusion Ordered Spectroscopy (DOSY) | Selective (by size) | Attenuates large, slowly diffusing molecules |
| Multiple Suppression | Multiple Frequency Selective Pulses | Selective for multiple peaks | Complex pulse sequence design |
Protocol 3.1: Utilizing a T₂ Filter (CPMG) to Suppress Macromolecular Background Objective: Attenuate broad signals from polymeric biomaterial or protein aggregates to observe sharp signals from small molecule degradation products. Materials: NMR sample in standard 5 mm tube, Spectrometer with pulsed field gradient capability. Procedure:
- Place sample in spectrometer and lock, shim, and tune.
- Use a standard 1D ¹H pulse sequence with a CPMG (Carr-Purcell-Meiboom-Gill) filter insert:
[90°x - (τ - 180°y - τ)n - Acquire]. - Set the total filter time
(2nτ)to 50-200 ms. This will suppress signals with short T₂ relaxation times (broad peaks from large molecules). - Set τ to 1-2 ms and adjust
nto achieve the desired total filter time. - Acquire the spectrum with sufficient scans.
- Compare with a standard 1D spectrum (no CPMG) to identify the suppressed (matrix) and retained (small molecule) signals.
The Scientist's Toolkit
Table 4: Essential Research Reagent Solutions & Materials
| Item | Function in SEC HPLC NMR for Degradation Studies |
|---|---|
| Deuterated SEC Solvents (e.g., D₂O, DMF-d7) | Provides NMR lock signal while maintaining chromatographic separation integrity. |
| SEC-HPLC Columns (e.g., Polyhydroxyethyl A, silica-based) | Separates components by hydrodynamic size, critical for simplifying complex NMR spectra. |
| Cryogenic NMR Probe (3mm or 1.7mm) | Dramatically increases sensitivity for low-concentration analites in limited sample volumes. |
| LC-NMR Flow Probe (with Stop-flow capability) | Allows direct NMR analysis of HPLC eluents, enabling correlation of chromatographic and spectroscopic data. |
| Pulse Sequences for Solvent Suppression (e.g., WET, NOESY-presat) | Manages dynamic range by attenuating the large solvent signal to observe nearby analyte peaks. |
| Software for Non-Uniform Sampling (NUS) | Enables acquisition of high-resolution 2D/3D NMR data in feasible timeframes, resolving overlap. |
| Stable Radicals (for DNP) e.g., TEKPol, AMUPol | Polarizing agents for DNP NMR, providing massive sensitivity gains for trace analysis. |
| Micro NMR Tubes (1mm/1.7mm) | Maximizes filling factor for precious, mass-limited samples when used with matched microprobes. |
Visualization of Workflows and Relationships
Title: SEC-HPLC-NMR Stop-Flow Analysis Workflow
Title: Strategies to Resolve NMR Signal Overlap
Title: Managing NMR Dynamic Range for Trace Analysis
Within the context of research utilizing SEC-HPLC-NMR for quantifying biomaterial degradation products, the integration of multiple orthogonal techniques presents both immense power and significant risk for data misinterpretation. This protocol details systematic approaches to avoid common pitfalls in peak misidentification and quantification inaccuracies that can compromise conclusions in drug development and biomaterials science.
The primary error categories in SEC-HPLC-NMR analysis of degradation products stem from co-elution, solvent/background interference, NMR spectral overlap, and improper calibration.
Table 1: Common Data Interpretation Errors and Corrective Actions
| Error Type | Cause | Consequence | Corrective Protocol |
|---|---|---|---|
| Peak Misidentification | Co-elution of degradants; Impurity carryover | False positive identification; Over/under-reporting | Implement 2D LC (e.g., SEC x RP); Use heart-cutting for NMR |
| Quantification Inaccuracy | Nonlinear detector response; Improper baseline integration | Invalid kinetic degradation models | Multi-level internal standard calibration; Use of qNMR with certified standards |
| Background Interference | HPLC solvent/system peaks; NMR buffer signals | Obscured low-abundance degradants | Run matched blank gradients; Use solvent suppression (e.g., WET, PRESAT) in NMR |
| Spectral Misassignment | Overlap in 1H NMR; Conformational exchange | Wrong structure elucidation | Acquire 2D NMR (COSY, HSQC) at multiple temperatures; Spiking experiments |
Detailed Experimental Protocols
Protocol 1: Orthogonal Verification for Peak Identity in SEC-HPLC-NMR
Objective: To unambiguously identify a suspected polymeric biomaterial degradation product collected from an SEC fraction. Materials: SEC-HPLC system (with fraction collector), NMR spectrometer (≥ 400 MHz), appropriate deuterated solvent, solid-phase extraction (SPE) cartridges. Procedure:
- SEC Separation: Inject sample (100 µL of 10 mg/mL digest). Use aqueous mobile phase (e.g., 50 mM ammonium acetate, pH 6.8). Collect the eluting fraction of interest (e.g., 30-32 min) based on RI/UV signal.
- Solute Concentration: Lyophilize the collected fraction. Reconstitute in minimal deuterated NMR solvent (e.g., D₂O, 200 µL).
- 1D ¹H NMR Screening: Acquire standard 1D NMR spectrum with water suppression. Note any anomalous peaks vs. parent compound.
- 2D NMR Confirmation: If identity is ambiguous, acquire 2D experiments (¹H-¹³C HSQC, ¹H-¹H COSY) on the isolated fraction to establish connectivity.
- Cross-Validation: Compare retention time (SEC), UV spectrum (if applicable), and NMR fingerprint to a synthetically prepared degradant standard, if available. Data Interpretation: Confirmation requires concordance across all three dimensions: SEC elution volume (molecular weight), UV profile (chromophore), and NMR-derived structure.
Protocol 2: Absolute Quantification of Degradants via qNMR with Internal Standard
Objective: To accurately quantify the molar concentration of a specific degradation product in a complex mixture. Materials: Certified qNMR standard (e.g., 1,4-Bis(trimethylsilyl)benzene-d₄, maleic acid), high-precision NMR tube, calibrated analytical balance. Procedure:
- Standard Solution Preparation: Precisely weigh (~10 mg) the internal standard (IS) and dissolve in deuterated solvent to make a primary stock solution. Determine its exact concentration (mM).
- Sample Preparation: Add a precise volume (e.g., 500 µL) of the IS stock solution to the lyophilized SEC fraction. Dissolve completely.
- NMR Acquisition: Acquire a quantitative ¹H NMR spectrum using a long relaxation delay (≥ 5xT1, typically 30-40 seconds), 90° pulse, and sufficient scans for high S/N. Do not use solvent suppression.
- Integration: Integrate a unique, well-resolved signal from the target degradant and a unique signal from the IS.
- Calculation: Use the formula: C_unknown = (A_unknown / A_IS) x (N_IS / N_unknown) x C_IS, where A is integral area, N is the number of protons giving rise to the signal, and C is concentration. Data Interpretation: The qNMR result provides absolute quantity in the NMR tube. Back-calculate to the original sample, accounting for all dilution/concentration steps from SEC collection.
Visualizing Workflows and Relationships
Title: SEC-HPLC-NMR Workflow for Degradant Analysis
Title: Error Causes and Solutions Map
The Scientist's Toolkit: Research Reagent Solutions
Table 2: Essential Materials for SEC-HPLC-NMR Degradation Studies
| Item | Function & Rationale | Key Consideration |
|---|---|---|
| SEC Columns (e.g., Tosoh TSK-Gel) | Separation based on hydrodynamic size. Critical for resolving oligomeric degradation products from parent polymer. | Choose pore size matched to polymer MW range; use aqueous/organic columns compatible with NMR. |
| Deuterated NMR Solvents (e.g., D₂O, CD₃OD) | Provides lock signal for NMR spectrometer; minimizes solvent interference in ¹H spectrum. | Must be compatible with SEC mobile phase for direct analysis of fractions. |
| Certified qNMR Standards (e.g., Maleic Acid) | Provides absolute quantitative reference for calculating molar concentration of degradants via ¹H NMR integration. | Must be chemically stable, pure, have non-overlapping signals, and known proton count. |
| Internal Standards for HPLC (e.g., Acetone, NaN₃) | Monitors HPLC system performance, retention time stability, and injection volume accuracy. | Must be inert, detectable (UV/RI), and not interfere with sample components. |
| Solid-Phase Extraction (SPE) Cartridges | Desalting and concentration of SEC fractions prior to NMR, removing buffers incompatible with NMR. | Choose stationary phase (C18, polymeric) that retains the target degradant. |
| Deuterated Buffer Salts (e.g., (NH₄)₂CO₃-d) | Allows use of pH-relevant mobile phases in SEC that can be directly compatible with NMR after minimal adjustment. | Reduces the need for buffer exchange, minimizing sample loss. |
Validation, Compliance, and Technique Comparison: Ensuring Robust and Defensible Data
Application Notes: Validation within Biomaterial Degradation Research
Validation per ICH Q2(R1) is a foundational requirement for the analytical control strategy in pharmaceutical development. Within a thesis focusing on SEC HPLC-NMR techniques for quantifying biomaterial degradation products, method validation ensures the reliability of data used to elucidate degradation pathways, polymer breakdown kinetics, and the safety profile of leachables. SEC (Size Exclusion Chromatography) separates fragments by hydrodynamic volume, HPLC provides quantitative analysis, and NMR offers structural elucidation. Validating this hyphenated methodology is critical for correlating quantitative data with structural identity, a cornerstone for regulatory filings of biodegradable implants, scaffolds, or nanoparticle drug delivery systems.
Specificity is paramount, as it must distinguish the parent biomaterial (e.g., a PLA-PEG copolymer) from its heterogeneous degradation products (lactic acid, oligomers, cyclic compounds) in complex in vitro or in vivo matrices. Linearity, Accuracy, and Precision establish the quantitative relationship and reliability for key analytes across expected concentration ranges. LOD/LOQ determine the method's sensitivity to detect and quantify trace-level degradants with potential toxicological significance. This validated protocol directly supports the thesis hypothesis that SEC HPLC-NMR is a robust platform for comprehensive biomaterial lifecycle analysis.
Experimental Protocols & Data
Protocol 1: Specificity Assessment via Forced Degradation
Objective: To demonstrate the method's ability to resolve the intact biomaterial from its degradation products under stress conditions. Procedure:
- Prepare a standard solution of the biomaterial (e.g., 1 mg/mL in mobile phase).
- Subject aliquots to stress conditions:
- Acidic/Basic Hydrolysis: Add 1 mL of 0.1M HCl or NaOH, incubate at 60°C for 4 hours, neutralize.
- Oxidative Stress: Add 1 mL of 3% H₂O₂, incubate at 25°C for 6 hours.
- Thermal Stress: Incubate solid material at 80°C for 24 hours, then dissolve.
- Photolytic Stress: Expose solid material to UV light (≥ 200 Watt·hr/m²).
- Analyze stressed samples, unstressed standard, and blank (matrix) using the SEC HPLC-NMR method.
- Compare chromatograms (SEC-HPLC) and spectra (NMR) to confirm baseline separation of degradation peaks from the main peak and absence of interference from the matrix.
Protocol 2: Linearity & Range
Objective: To establish a proportional relationship between analyte concentration and detector response. Procedure:
- Prepare a minimum of five concentrations of the primary analyte standard (e.g., a key degradant like glycolic acid) across the specified range (e.g., 50% to 150% of target concentration).
- Inject each solution in triplicate. Use HPLC-UV or HPLC-RI data for quantification.
- Plot mean peak area vs. concentration. Perform least-squares linear regression.
- Calculate correlation coefficient (r), slope, y-intercept, and residual sum of squares.
Protocol 3: Accuracy (Recovery)
Objective: To determine the closeness of agreement between the measured value and the true value. Procedure (Standard Addition Method):
- Spike a known matrix (e.g., phosphate-buffered saline or simulated body fluid) with the analyte at three levels (e.g., 80%, 100%, 120% of target).
- Prepare triplicate samples for each level alongside unspiked matrix and a pure reference standard.
- Analyze all samples.
- Calculate % Recovery: (Measured Concentration in Spiked Matrix / Theoretical Spiked Concentration) × 100%.
Protocol 4: Precision
Objective: To assess the degree of scatter among a series of measurements. Procedure:
- Repeatability (Intra-day): Inject six independent preparations of the same sample (100% level) on the same day by the same analyst.
- Intermediate Precision (Inter-day): Repeat the repeatability study on a different day, with a different analyst and/or a different HPLC system.
- Calculate the mean, standard deviation (SD), and relative standard deviation (%RSD) for the measured concentration or peak area.
Protocol 5: LOD & LOQ Determination
Objective: To determine the lowest concentration detectable and quantifiable with acceptable accuracy and precision. Procedure (Based on Signal-to-Noise):
- Analyze progressively lower concentrations of the analyte.
- For a representative low-concentration sample, measure the peak height (P) and the baseline noise (N) over a region adjacent to the peak.
- LOD: The concentration where P/N ≈ 3.
- LOQ: The concentration where P/N ≈ 10. Confirm by analyzing six replicates at the LOQ level; %RSD should be ≤ 10%.
Table 1: Specificity Data for Key Degradants
| Degradant (from PLA-PEG) | Retention Time (min) | Resolution from Main Peak | NMR Chemical Shift (Key Proton) |
|---|---|---|---|
| Lactic Acid | 12.5 | 4.5 | δ 1.33 (d, CH₃) |
| Lactyl Lactate (dimer) | 10.2 | 2.8 | δ 5.15 (q, CH) |
| Acetaldehyde | 9.8 | 1.5 | δ 9.80 (d, CHO) |
| Intact Polymer (Main Peak) | 8.1 | N/A | δ 5.20 (m, CH), δ 3.65 (s, PEG) |
Table 2: Linearity & Accuracy Data for Glycolic Acid (Key Degradant)
| Nominal Conc. (µg/mL) | Mean Measured Conc. (µg/mL) | SD | %RSD (Precision) | % Recovery (Accuracy) | Regression Statistics (y = mx + c) |
|---|---|---|---|---|---|
| 8.0 (LOQ) | 7.9 | 0.3 | 3.8% | 98.8% | Slope (m): 12540 |
| 20.0 | 19.7 | 0.5 | 2.5% | 98.5% | Intercept (c): 850 |
| 50.0 | 50.5 | 1.1 | 2.2% | 101.0% | R²: 0.9995 |
| 80.0 | 79.2 | 1.8 | 2.3% | 99.0% | Range: 8-100 µg/mL |
| 100.0 | 99.0 | 2.1 | 2.1% | 99.0% |
Table 3: Precision Results (n=6)
| Precision Level | Analyte (Conc.) | Mean Area/Conc. | SD | %RSD | ICH Q2(R1) Typical Target |
|---|---|---|---|---|---|
| Repeatability | Glycolic Acid (50 µg/mL) | 628500 | 13200 | 2.1% | NMT 3% |
| Intermediate Precision | Glycolic Acid (50 µg/mL) | 621800 | 18600 | 3.0% | NMT 5% |
Table 4: LOD/LOQ Data via S/N Method
| Analytic | LOD (S/N=3) | LOQ (S/N=10) | %RSD at LOQ (n=6) |
|---|---|---|---|
| Glycolic Acid | 2.5 µg/mL | 8.0 µg/mL | 3.8% |
| Lactic Acid | 1.8 µg/mL | 5.5 µg/mL | 4.1% |
| Acetaldehyde | 0.5 µg/mL | 1.5 µg/mL | 5.2% |
Visualizations
Title: SEC HPLC-NMR Workflow & Validation Integration
Title: ICH Q2(R1) Validation Parameter Relationships
The Scientist's Toolkit: Key Research Reagent Solutions
Table 5: Essential Materials for SEC HPLC-NMR Method Validation
| Item | Function in Validation | Example/Notes |
|---|---|---|
| Biomaterial Reference Standard | Primary substance for specificity, linearity, and precision studies. Must be well-characterized. | Poly(lactic-co-glycolic acid) (PLGA) with certified molecular weight distribution. |
| Certified Degradant Standards | Used to prepare calibration standards for linearity, accuracy, LOD/LOQ. | Glycolic acid, Lactic acid, Succinic acid (USP-grade). |
| SEC HPLC Columns | Perform size-based separation of intact polymer and fragments. | Tosoh TSKgel GMPWxl, Agilent PL aquagel-OH. |
| NMR-Compatible SEC Solvent | Acts as HPLC mobile phase and NMR solvent. Must be deuterated for on-line NMR. | Deuterated phosphate buffer (D₂O, pD 7.4), Deuterated DMF. |
| Forced Degradation Reagents | Used in specificity protocols to generate degradation products. | 0.1M HCl/NaOH, 3% H₂O₂, for hydrolysis/oxidation. |
| Simulated Biological Matrix | Used in accuracy (recovery) studies to mimic in vivo conditions. | Simulated Body Fluid (SBF), Phosphate Buffered Saline (PBS). |
| Quantitative NMR (qNMR) Internal Standard | Enables absolute quantification by NMR, cross-validating HPLC data. | Dimethyl sulfone (DMSO₂), Sodium 3-(trimethylsilyl)-1-propanesulfonate (DSS-d₆). |
| System Suitability Standards | Verify column performance and system precision daily. | Narrow dispersity polyethylene glycol or polystyrene standards. |
Within the context of a broader thesis on the quantification of biomaterial degradation products, the selection of an appropriate analytical technique is critical. Size Exclusion Chromatography (SEC), High-Performance Liquid Chromatography (HPLC), and Nuclear Magnetic Resonance (NMR) spectroscopy are three cornerstone methodologies, each with distinct strengths and limitations. This article provides a comparative analysis and detailed application notes for their use in characterizing polymeric biomaterials, oligomeric fragments, and small-molecule degradation products.
Table 1: Core Characteristics and Performance Metrics
| Feature | Size Exclusion Chromatography (SEC) | High-Performance Liquid Chromatography (HPLC) | Nuclear Magnetic Resonance (NMR) |
|---|---|---|---|
| Primary Measured Property | Hydrodynamic volume / Molecular weight | Chemical affinity / Polarity | Chemical structure / Atomic environment |
| Key Strength | Determination of molecular weight distributions and averages. | High-resolution separation and quantification of complex mixtures. | Provides definitive structural identification without need for standards. |
| Key Limitation | Poor resolution for similar sizes; no chemical identification. | Requires method development; may need analyte derivatization. | Lower sensitivity; requires relatively pure or concentrated samples. |
| Typical Sample Requirement | 0.1-1 mg (for polymeric analysis) | 10 ng - 100 µg | 0.1-10 mg (for 1D ¹H NMR) |
| Analysis Time | 20-40 minutes per run | 10-60 minutes per run | 5 minutes to several hours |
| Quantitative Capability | Good (with appropriate calibration) | Excellent (high sensitivity, wide dynamic range) | Good (absolute quantification with internal standards) |
| Information Output | Mw, Mn, PDI (D) | Concentration, purity, identity (with detectors like MS) | Molecular structure, composition, dynamics, degradation mechanisms. |
| Ideal for Product Type | Intact polymers, protein aggregates, large fragments. | Small molecules, oligomers, isomers, degradation products in mixture. | Molecular structure elucidation, end-group analysis, monitoring hydrolysis/cleavage. |
Table 2: Suitability for Biomaterial Degradation Product Analysis
| Product Type / Analysis Goal | SEC | HPLC | NMR |
|---|---|---|---|
| Polymer Molecular Weight Change | Excellent (Primary method) | Poor | Fair (Requires specific pulse sequences) |
| Oligomeric Fragment Separation | Good (for size-based separation) | Excellent (Reverse-phase or HILIC) | Good (if resolvable signals) |
| Small Molecule Identification | Not Suitable | Excellent (coupled with MS) | Excellent (Definitive structure) |
| Monitoring Real-time Degradation | Poor (Offline) | Poor (Offline) | Excellent (In situ capability) |
| Quantifying Specific Degradants | Fair (if standards available) | Excellent | Good (with internal standard) |
| End-Group Analysis | Not Suitable | Difficult | Excellent (Direct observation) |
Detailed Application Notes & Protocols
Application Note 1: SEC for Monitoring Polymeric Chain Scission
Objective: To quantify the decrease in average molecular weight of a polylactic acid (PLA) scaffold during hydrolytic degradation.
Principle: SEC separates polymer chains based on their hydrodynamic volume in solution. As degradation proceeds, chain scission increases the population of lower molecular weight species, reducing the weight-average molecular weight (Mw).
Protocol:
- Sample Preparation: Weigh 2 mg of degraded PLA film. Dissolve in tetrahydrofuran (THF) containing 0.1% w/v butylated hydroxytoluene (BHT) as stabilizer. Agitate for 4 hours at room temperature. Filter through a 0.45 µm PTFE syringe filter.
- SEC System Setup:
- Columns: Two PLgel Mixed-C columns in series.
- Mobile Phase: THF at 1.0 mL/min.
- Detector: Refractive Index (RI) detector, temperature at 35°C.
- Injection Volume: 100 µL.
- Calibration: Use narrow dispersity polystyrene standards (1-1000 kDa).
- Data Analysis: Process chromatograms using SEC software (e.g., Cirrus). Report Mw, number-average molecular weight (Mn), and dispersity (Đ). Plot Mw vs. degradation time to model degradation kinetics.
Application Note 2: HPLC-MS for Profiling Oligomeric Degradation Products
Objective: To separate, identify, and quantify specific oligomeric fragments released from a hydrolyzing poly(lactic-co-glycolic acid) (PLGA) microsphere formulation.
Principle: Reverse-phase HPLC separates oligomers by hydrophobicity, while tandem mass spectrometry (MS/MS) provides identity based on mass-to-charge ratio and fragmentation patterns.
Protocol:
- Sample Preparation: Centrifuge degradation medium at 10,000 x g for 10 min. Dilute supernatant 1:10 with 0.1% formic acid in water. Filter through a 0.22 µm PVDF filter.
- HPLC-MS/MS Method:
- Column: C18 column, 2.1 x 150 mm, 1.7 µm particles.
- Mobile Phase A: 0.1% Formic acid in water.
- Mobile Phase B: 0.1% Formic acid in acetonitrile.
- Gradient: 5% B to 95% B over 15 min, hold 2 min.
- Flow Rate: 0.3 mL/min.
- MS Detection: Electrospray Ionization (ESI) in negative mode. Full scan (m/z 100-2000) and data-dependent MS/MS on top 5 ions.
- Quantification: Generate calibration curves using synthesized lactic acid and glycolic acid oligomer standards. Use extracted ion chromatograms for quantification of identified species.
Application Note 3: NMR forIn-situStructural Analysis of Degradation
Objective: To directly observe the structural changes and formation of specific functional groups during the enzymatic degradation of a novel polyester.
Principle: ¹H NMR chemical shifts are sensitive to the local chemical environment. The appearance of new signals (e.g., carboxylates, alcohols) and disappearance of others (e.g., ester bonds) provide a direct measure of degradation chemistry.
Protocol:
- Sample Preparation for In-situ NMR: Place 20 mg of polymer in an NMR tube. Add 600 µL of deuterated phosphate buffer (pD 7.4). Add enzyme solution (in D₂O). Mix thoroughly.
- NMR Acquisition:
- Instrument: 500 MHz spectrometer with a broadband observe probe.
- Experiment: Single-pulse ¹H NMR with water suppression (e.g., presaturation).
- Parameters: 90° pulse, spectral width 20 ppm, acquisition time 3 sec, relaxation delay 5 sec, 16 scans per spectrum.
- Kinetics: Acquire sequential spectra every 15-30 minutes over 24-48 hours at 37°C.
- Data Analysis: Integrate characteristic peaks: ester methylene protons (~4.3 ppm), terminal alcohol protons (~3.6 ppm), and carboxylic acid protons (~12 ppm). Plot normalized integrals vs. time to track bond cleavage and product formation.
Visualizations
Analytical Technique Synergy for Degradation Analysis
SEC Protocol for Polymer Molecular Weight Analysis
The Scientist's Toolkit
Table 3: Key Research Reagent Solutions & Materials
| Item | Function in Degradation Product Analysis |
|---|---|
| Narrow Dispersity Polystyrene Standards | Essential for calibrating SEC systems to derive accurate molecular weight distributions of unknown polymers. |
| Deuterated Solvents (e.g., D₂O, CDCl₃) | Provides the lock signal for NMR spectrometers and allows for analysis without interfering solvent proton signals. |
| Synthetic Oligomer Standards | Critical for developing and validating quantitative HPLC-MS methods for specific degradation fragments. |
| Stabilized THF (with BHT) | Prevents peroxide formation in SEC mobile phase, which can degrade columns and alter polymer samples. |
| Formic Acid / Ammonium Acetate | Common volatile additives for HPLC mobile phases to control pH and improve ionization in ESI-MS detection. |
| Internal Standard (e.g., TMS, maleic acid) | Added in known concentration to NMR or HPLC samples for absolute quantification of analytes. |
| 0.22 µm PVDF Syringe Filters | For particulate removal from samples prior to HPLC or SEC injection, preventing column blockage. |
| Size Exclusion Columns (e.g., PLgel, TSKgel) | Packed with porous beads to separate polymers by size; choice of pore size depends on Mw range of interest. |
This document provides detailed application notes and protocols, framed within a thesis utilizing SEC-HPLC-NMR techniques for the quantification of biomaterial degradation products. Validated analytical workflows are essential for understanding the in vitro and in vivo fate of polymers like polylactic acid (PLA), polyglycolic acid (PGA), and polyethylene glycol (PEG), which impacts drug release kinetics, device safety, and therapeutic efficacy.
Application Note 1: Quantifying PLA Hydrolytic Degradation
Objective: To monitor the time-dependent hydrolysis of PLA (Mw: 50 kDa) and quantify lactic acid oligomers using a coupled SEC-HPLC-NMR workflow.
Key Quantitative Data:
Table 1: PLA Degradation Profile Over 12 Weeks in PBS (pH 7.4, 37°C)
| Time Point (Weeks) | Weight Loss (%) | Number-Avg Mw (kDa) | Dominant Oligomer (SEC Peak) | Lactic Acid Conc. (µg/mL, HPLC) |
|---|---|---|---|---|
| 0 | 0.0 | 50.0 | >10 mer | 0.0 |
| 4 | 15.2 | 32.5 | 6-10 mer | 45.7 |
| 8 | 41.8 | 18.1 | 3-5 mer | 128.3 |
| 12 | 78.5 | 5.4 | dimer/monomer | 310.9 |
Experimental Protocol:
- Sample Preparation: Inculate 20 mg of PLA film (10 mm x 10 mm) in 10 mL of phosphate-buffered saline (PBS, 0.1 M, pH 7.4) containing 0.02% sodium azide at 37°C in a shaking incubator (50 rpm).
- Time-Point Sampling: At predetermined intervals (e.g., 0, 2, 4, 8, 12 weeks), remove triplicate samples. Rinse with DI water, dry in vacuo for 48 hours, and weigh for mass loss.
- SEC Analysis: Dissolve dried polymer residue in THF (HPLC grade) at 2 mg/mL. Filter through a 0.45 µm PTFE syringe filter. Inject 50 µL onto a PLgel Mixed-C column (300 x 7.5 mm) at 35°C with THF mobile phase (1 mL/min). Use polystyrene standards for calibration.
- HPLC-NMR Analysis: Acidify the aqueous degradation medium to pH 2.5 with H3PO4. Inject 100 µL onto a reversed-phase C18 column (150 x 4.6 mm) at 40°C. Use gradient elution: Solvent A (0.1% TFA in H2O), Solvent B (0.1% TFA in Acetonitrile). Flow rate: 1 mL/min. Eluting species are directly coupled to a 600 MHz NMR spectrometer with a flow probe for 1H NMR structural confirmation of oligomers.
Application Note 2: Monitoring PGAIn VitroDegradation and Glycolic Acid Release
Objective: To establish a correlation between PGA scaffold molecular weight loss and glycolic acid accumulation in simulated physiological fluid.
Key Quantitative Data:
Table 2: PGA Degradation and Byproduct Analysis
| Analysis Method | Key Parameter Measured | Typical Result (8 weeks) | Calibration Standard |
|---|---|---|---|
| SEC-MALS | Mw, Mn, PDI | Mn: 8.2 kDa, PDI: 1.9 | PEG/PGA narrow standards |
| HPLC-UV | Glycolic acid concentration | 1.8 mg/mL | Glycolic acid (Sigma) |
| 1H NMR | Monomer/Dimer ratio | 4:1 | N/A |
Experimental Protocol:
- Accelerated Degradation Study: Place 50 mg of PGA mesh into 15 mL of tris-buffer (0.1 M, pH 7.4) at 50°C to accelerate hydrolysis. Sample weekly.
- SEC-MALS Analysis: Dissolve a portion of the retrieved mesh in HFIP (Hexafluoroisopropanol). Analyze using a HFIP-SEC system (PSS PFG column) coupled to a Multi-Angle Light Scattering (MALS) detector for absolute molecular weight determination without column calibration.
- Glycolic Acid Quantification: Filter the degradation buffer (0.22 µm nylon). Perform HPLC using an Aminex HPX-87H ion-exchange column at 50°C with 5 mM H2SO4 as mobile phase (0.6 mL/min). Detect glycolic acid at 210 nm. Use an external standard curve (0.01-1.0 mg/mL).
- NMR Sample Prep: Lyophilize 1 mL of filtered degradation medium. Reconstitute in 600 µL of D2O containing 0.05% TSP-d4 as chemical shift reference. Acquire 1H NMR spectra (64 scans).
Application Note 3: Characterizing PEG Chain Cleavage in Conjugates
Objective: To detect and quantify low-level cleavage of PEG chains from a PEGylated protein therapeutic under oxidative stress.
Protocol for Oxidative Stress Testing & Analysis:
- Stress Induction: Incubate PEGylated protein (1 mg/mL) in PBS with 0.1% H2O2 at 25°C for 24 hours. Include a control without H2O2.
- SEC-HPLC Separation: Use an analytical size-exclusion column (e.g., TSKgel G3000SWXL). Isocratic elution with PBS (pH 6.8) at 0.5 mL/min. Monitor at 280 nm (protein) and 210 nm (PEG).
- Fraction Collection: Collect the peak corresponding to free PEG (lower MW than the main conjugate peak).
- NMR Analysis: Concentrate the free PEG fraction using centrifugal evaporation. Analyze by 1H NMR in D2O. The characteristic singlet for the PEG backbone (-O-CH2-CH2-) at ~3.6 ppm confirms identity. Integrate against an added internal standard (e.g., dimethyl sulfone) for quantification.
The Scientist's Toolkit
Table 3: Essential Research Reagent Solutions
| Item / Reagent | Function / Application |
|---|---|
| Phosphate Buffered Saline (PBS), 0.1M, pH 7.4 | Standard medium for simulating physiological hydrolytic degradation. |
| Hexafluoroisopropanol (HFIP) | Solvent for dissolving polyesters (PLA, PGA) for SEC analysis. |
| Aminex HPX-87H Column | Ion-exclusion HPLC column for separating and quantifying acidic degradation products (lactic, glycolic acid). |
| Tetrahydrofuran (THF), HPLC Grade | Mobile phase for SEC of many polymers in organic mode. |
| D2O with 0.05% TSP-d4 | Solvent for NMR analysis providing lock signal and chemical shift reference. |
| PLgel or PSS PFG SEC Columns | Size-exclusion columns for polymer separation based on hydrodynamic volume. |
| Hydrogen Peroxide (H2O2), 3% solution | Used to induce oxidative stress studies on PEG and other susceptible polymers. |
| Polystyrene & PEG Narrow Standards | Essential for calibrating SEC systems for molecular weight determination. |
Workflow and Pathway Visualizations
Diagram 1: Integrated SEC-HPLC-NMR Workflow for Polyester Degradation
Diagram 2: Biomaterial Degradation Biological Impact Pathway
This application note details the critical data requirements and protocols for regulatory submissions to the U.S. Food and Drug Administration (FDA), the European Medicines Agency (EMA), and for ISO 10993 (Biological evaluation of medical devices) compliance, specifically within the context of a research thesis employing Size Exclusion Chromatography-High Performance Liquid Chromatography-Nuclear Magnetic Resonance (SEC HPLC NMR) techniques for quantifying biomaterial degradation products.
Successful submissions require comprehensive characterization data for degradation products, including their identity and quantity. The following table summarizes the core quantitative data expectations across the three regulatory frameworks.
Table 1: Key Data Requirements for Degradation Product Quantification
| Requirement / Agency | FDA (CDER/CBER) | EMA | ISO 10993 Series (e.g., -13, -17) |
|---|---|---|---|
| Primary Guideline | ICH Q3B(R2) (Impurities), ICH Q6A | ICH Q3B(R2), ICH Q6A | ISO 10993-13: Identification/Quantification of Degradation Products; ISO 10993-17: Toxicological Risk Assessment |
| Threshold for Identification | ≥ 0.1% of drug substance | ≥ 0.1% of drug substance | Based on risk; often ≤ 1-5 µg/day for carcinogens, higher for others |
| Threshold for Qualification (Toxicological Assessment) | ≥ 0.15% or 1.0 mg/day intake (whichever is lower) | ≥ 0.15% or 1.0 mg/day intake (whichever is lower) | Requires derivation of Allowable Limit (Tolerable Exposure, TE) based on toxicological data |
| Required Analytical Data | Structure elucidation, mass balance, method validation (ICH Q2(R1)), justification of acceptance criteria | Structure elucidation, mass balance, method validation, justification of acceptance criteria | Quantification, identification where possible, method validation (accuracy, precision, LOD/LOQ), linkage to risk assessment |
| Key Submission Section | Chemistry, Manufacturing, and Controls (CMC), Nonclinical Study Reports | Quality Part, Nonclinical Overview | Chemical Characterization Report (per ISO 10993-18), Biological Evaluation Report |
Experimental Protocols
Protocol 1: Integrated SEC HPLC NMR Analysis for Degradation Product Profiling
Objective: To separate, quantify, and structurally identify soluble degradation products from a biomaterial (e.g., polymeric scaffold) using an integrated SEC HPLC NMR workflow.
Materials & Reagents:
- Test Sample: Degraded biomaterial (e.g., post-hydrolytic/oxidative stress).
- Mobile Phase: 0.1M Sodium phosphate buffer, pH 7.4, with 0.05% sodium azide (or other biocompatible buffer matching in vivo conditions). Note: Must be volatile if coupling to MS, or deuterated for direct NMR coupling.
- Standards: Polyethylene glycol (PEG) or polyethylene oxide (PEO) standards for SEC calibration. Authentic standards of suspected degradation products (e.g., monomers, oligomers).
- Equipment: SEC-HPLC system with isocratic pump, autosampler, column oven, and multi-detector array (Refractive Index (RI), UV/VIS, Multi-Angle Light Scattering (MALS), viscometer). NMR spectrometer (≥ 400 MHz) with a liquid chromatography-NMR coupling interface (e.g., loop storage or stop-flow).
Procedure:
- Sample Preparation: Centrifuge the degradation medium at 10,000 x g for 15 minutes. Filter supernatant through a 0.22 µm nylon membrane.
- SEC Method:
- Column: Two serially connected SEC columns (e.g., 300 mm x 7.8 mm) with appropriate pore sizes for the expected MW range (e.g., 10^2 - 10^5 Da).
- Flow Rate: 0.8 mL/min.
- Injection Volume: 100 µL.
- Detection: Sequential RI (concentration), UV (chromophore identification), MALS/viscometer (absolute MW).
- Collect eluent fractions of interest (e.g., low MW tail) based on detector responses.
- NMR Analysis:
- Direct Hyphenation: Use a stopped-flow or loop-collection interface. Transfer the HPLC eluent fraction directly into the NMR flow probe.
- At-line Analysis: Lyophilize collected fractions and reconstitute in deuterated solvent (e.g., D2O).
- Acquire 1H NMR spectra (with water suppression if needed). Perform 2D experiments (COSY, HSQC, HMBC) on major components for structure elucidation.
- Quantification:
- Using the RI detector (concentration-sensitive) and MALS (absolute mass), quantify the total mass of degradation products.
- For specific identified compounds (via NMR), use calibration curves from authentic standards or quantitative NMR (qNMR) using an internal standard (e.g., dimethyl sulfone) to report concentration in µg/mL.
Protocol 2: Validation of the Analytical Method per ICH Q2(R1) for Regulatory Submission
Objective: To validate the SEC HPLC NMR-derived method for quantifying a specific degradation product to meet regulatory standards for specificity, accuracy, precision, and limit of quantification.
Procedure:
- Specificity: Demonstrate that the method can resolve and accurately quantify the target degradation product from other products and the matrix. Use spiked samples and compare chromatograms/NMR spectra from stressed vs. unstressed material.
- Linearity & Range: Prepare and analyze at least 5 concentrations of the reference standard across the expected range (e.g., 50-150% of the specification limit). The correlation coefficient (r) should be >0.998.
- Accuracy (Recovery): Spike the degradation product reference standard into the biomaterial test matrix at 80%, 100%, and 120% of the target level. Calculate mean recovery (should be 98-102%).
- Precision:
- Repeatability: Analyze six independently prepared samples at 100% of the target level. %RSD should be ≤ 2.0%.
- Intermediate Precision: Perform the analysis on a different day, with a different analyst and instrument. Combined %RSD should be ≤ 3.0%.
- Limit of Quantification (LOQ): Determine the lowest concentration that can be quantified with acceptable accuracy (80-120%) and precision (%RSD < 10%). This value must be below the reporting threshold (e.g., 0.1% per ICH).
Visualizations
Regulatory Decision Pathway for Degradation Data
Integrated SEC HPLC NMR Workflow
The Scientist's Toolkit: Key Research Reagent Solutions
Table 2: Essential Materials for SEC HPLC NMR Degradation Studies
| Item | Function & Rationale |
|---|---|
| Deuterated SEC Mobile Phase (e.g., D2O Buffer) | Enables direct hyphenation of SEC to NMR without solvent suppression issues, allowing real-time structural analysis. |
| PEG/PEO Calibration Kit | Provides molecular weight calibration for the SEC system, essential for reporting accurate size distributions of oligomeric degradation products. |
| qNMR Internal Standard (e.g., Dimethyl Sulfone-D6) | Certified reference material for quantitative NMR, allowing absolute quantification of identified degradation products without pure standards. |
| Biocompatible SEC Columns (e.g., Polyhydroxymethacrylate-based) | Minimizes non-specific interactions with polar/ionic degradation products, ensuring accurate separation by size only. |
| Authentic Degradation Reference Standards | Synthesized or commercially acquired monomers/oligomers expected from the biomaterial. Critical for method validation (accuracy, specificity) and definitive identification. |
| Stability-Indicating Stress Samples | Biomaterial subjected to controlled hydrolytic (pH, temp), oxidative, or photolytic stress. Provides a real-world test mixture for method development and identification of relevant degradants. |
Conclusion
Effective quantification of biomaterial degradation products is non-negotiable for ensuring the safety, efficacy, and regulatory approval of biomedical devices and drug delivery systems. As detailed, SEC provides essential molar mass distribution data, HPLC offers high-resolution separation and sensitive quantification, and NMR delivers unambiguous structural identification. A synergistic, validated approach combining these techniques is paramount. Future directions point toward increased automation, hyphenated SEC-HPLC-NMR systems, and advanced data analysis with machine learning to handle increasingly complex biodegradable materials. Mastering these analytical strategies empowers researchers to confidently predict in vivo performance, mitigate failure risks, and accelerate the translation of next-generation biomaterials into clinical practice.